Descargar para leer sin conexión

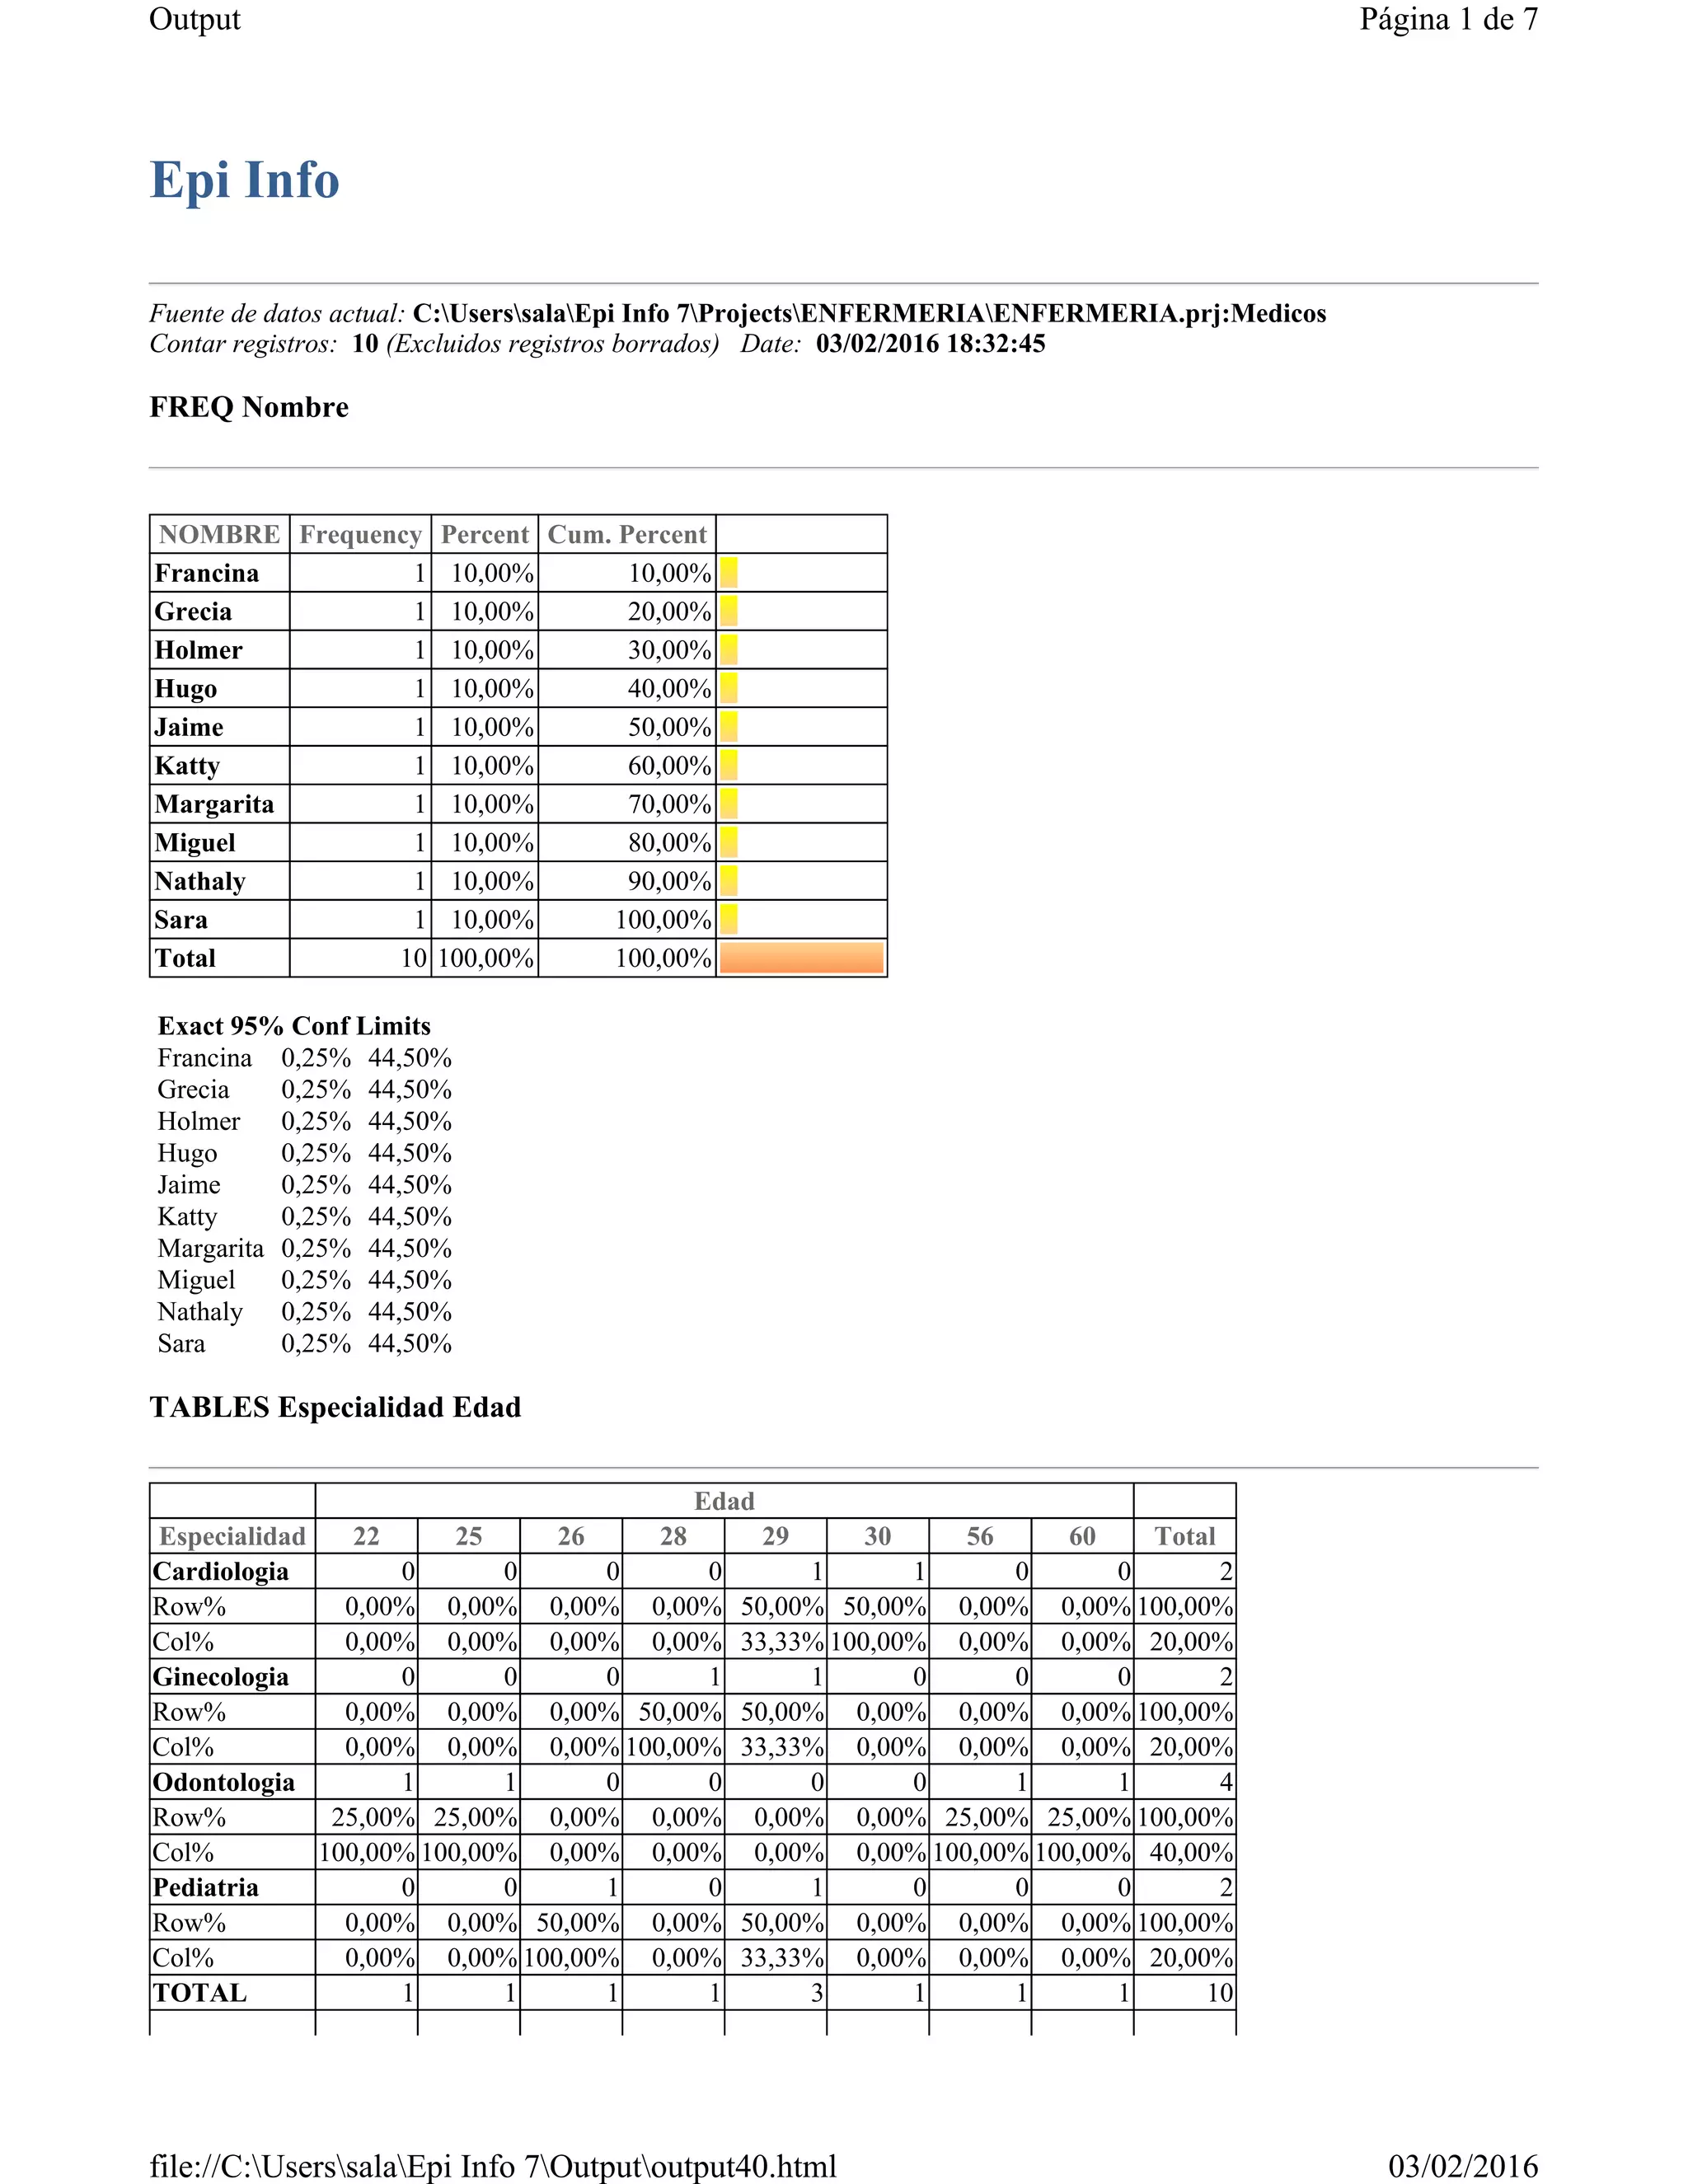
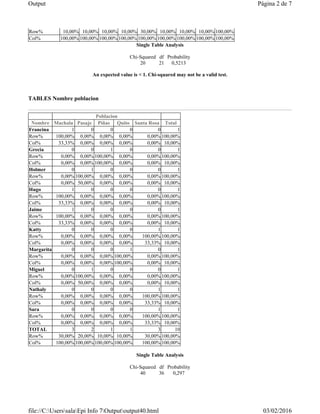


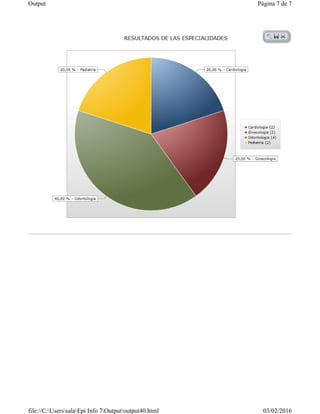

El documento presenta los resultados de un análisis de datos médicos de 10 registros utilizando el programa Epi Info. Muestra tablas de frecuencias de las especialidades y edades de los médicos, así como su distribución por lugar de residencia. La mayoría de los médicos tienen entre 26 y 30 años y se distribuyen en especialidades como cardiología, ginecología, odontología y pediatría.


