
Recomendados
Más contenido relacionado
Similar a Practica Individual Saúl Isaías Pérez Rosas.pdf
Similar a Practica Individual Saúl Isaías Pérez Rosas.pdf (11)
Último
Último (20)
Practica Individual Saúl Isaías Pérez Rosas.pdf
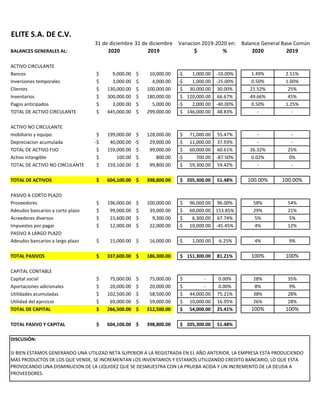
- 1. ELITE S.A. DE C.V. 31 de diciembre 31 de diciembre BALANCES GENERALES AL: 2020 2019 $ % 2020 2019 ACTIVO CIRCULANTE Bancos 9,000.00 $ 10,000.00 $ 1,000.00 -$ -10.00% 1.49% 2.51% Inversiones temporales 3,000.00 $ 4,000.00 $ 1,000.00 -$ -25.00% 0.50% 1.00% Clientes 130,000.00 $ 100,000.00 $ 30,000.00 $ 30.00% 21.52% 25% Inventarios 300,000.00 $ 180,000.00 $ 120,000.00 $ 66.67% 49.66% 45% Pagos anticipados 3,000.00 $ 5,000.00 $ 2,000.00 -$ -40.00% 0.50% 1.25% TOTAL DE ACTIVO CIRCULANTE 445,000.00 $ 299,000.00 $ 146,000.00 $ 48.83% - - ACTIVO NO CIRCULANTE mobiliario y equipo 199,000.00 $ 128,000.00 $ 71,000.00 $ 55.47% - - Depreciacion acumulada 40,000.00 -$ 29,000.00 -$ 11,000.00 -$ 37.93% - - TOTAL DE ACTIVO FIJO 159,000.00 $ 99,000.00 $ 60,000.00 $ 60.61% 26.32% 25% Activo intangible 100.00 $ 800.00 $ 700.00 -$ -87.50% 0.02% 0% TOTAL DE ACTIVO NO CIRCULANTE 159,100.00 $ 99,800.00 $ 59,300.00 $ 59.42% - - TOTAL DE ACTIVOS 604,100.00 $ 398,800.00 $ 205,300.00 $ 51.48% 100.00% 100.00% PASIVO A CORTO PLAZO Proveedores 196,000.00 $ 100,000.00 $ 96,000.00 $ 96.00% 58% 54% Adeudos bancarios a corto plazo 99,000.00 $ 39,000.00 $ 60,000.00 $ 153.85% 29% 21% Acreedores diversos 15,600.00 $ 9,300.00 $ 6,300.00 $ 67.74% 5% 5% Impuestos por pagar 12,000.00 $ 22,000.00 $ 10,000.00 -$ -45.45% 4% 12% PASIVO A LARGO PLAZO Adeudos bancarios a largo plazo 15,000.00 $ 16,000.00 $ 1,000.00 -$ -6.25% 4% 9% TOTAL PASIVOS 337,600.00 $ 186,300.00 $ 151,300.00 $ 81.21% 100% 100% CAPITAL CONTABLE Capital social 75,000.00 $ 75,000.00 $ - $ 0.00% 28% 35% Aportaciones adicionales 20,000.00 $ 20,000.00 $ - $ 0.00% 8% 9% Utilidades acumuladas 102,500.00 $ 58,500.00 $ 44,000.00 $ 75.21% 38% 28% Utilidad del ejercicio 69,000.00 $ 59,000.00 $ 10,000.00 $ 16.95% 26% 28% TOTAL DE CAPITAL 266,500.00 $ 212,500.00 $ 54,000.00 $ 25.41% 100% 100% TOTAL PASIVO Y CAPITAL 604,100.00 $ 398,800.00 $ 205,300.00 $ 51.48% Variacion 2019-2020 en: Balance General Base Común DISCUSIÓN: SI BIEN ESTAMOS GENERANDO UNA UTILIZAD NETA SUPERIOR A LA REGISTRADA EN EL AÑO ANTERIOR, LA EMPRESA ESTA PRODUCIENDO MAS PRODUCTOS DE LOS QUE VENDE, SE INCREMENTAN LOS INVENTARIOS Y ESTAMOS UTILIZANDO CREDITO BANCARIO, LO QUE ESTA PROVOCANDO UNA DISMINUCION DE LA LIQUIDEZ QUE SE DESMUESTRA CON LA PRUEBA ACIDA Y UN INCREMENTO DE LA DEUDA A PROVEEDORES.
- 2. ELITE S.A. DE C.V. 31 de diciembre 31 de diciembre ESTADO DE RESULTADOS 2020 2019 $ % 2020 2019 VENTAS NETAS 1,020,000.00 $ 1,013,000.00 $ 7,000.00 $ 0.69% - - (-) Costo de ventas 821,000.00 $ 814,000.00 $ 7,000.00 $ 0.86% 80.49% 80% (=) Utilidad bruta 199,000.00 $ 199,000.00 $ - $ 0.00% 19.51% 20% (-) Gatos de operación 104,000.00 $ 107,000.00 $ 3,000.00 -$ -2.80% 10.20% 11% (=) Utilidad de operación 95,000.00 $ 92,000.00 $ 3,000.00 $ 3.26% 9.31% 9.08% (-) Otros Gastos 300.00 $ 200.00 $ 100.00 $ 50.00% 0.03% 0.02% (=) U.A.F.I.R. 94,700.00 $ 91,800.00 $ 2,900.00 $ 3.16% 9.28% 9.06% (-) C.I.F. 13,700.00 $ 10,800.00 $ 2,900.00 $ 26.85% 1.34% 1.07% (=) U.A.I.R. 81,000.00 $ 81,000.00 $ - $ 0.00% 7.94% 8.00% (-) Impuestos 12,000.00 $ 22,000.00 $ 10,000.00 -$ -45.45% 1.18% 2.17% (=) Utilidad Neta 69,000.00 $ 59,000.00 $ 10,000.00 $ 16.95% 6.76% 5.82% 3) TASA RENDIMIENTO SOBRE LA INVERSION DE ACCIONISTAS 2) TASA DE RENDIMIENTO SOBRE LA INVERSION EN ACTIVOS: 16% Resultado: determina la eficiencia global en cuanto a la generación de utilidades con activos disponibles. Poder del capital invertido. 26% Resultado: Significa la rentabilidad de la inversión total de los accionistas. 3) ROTACION DE CUENTAS POR COBRAR 45.88 Resultado: Permite conocer la calidad de las cuentas por cobrar de una empresa y que tanto éxito tiene su cobro 2020 2020 1) UTILIDAD POR ACCION 92 Resultado: representa el total de ganancias que se obtienen por cada acción ordinaria vigente. RAZONES DE LIQUIDEZ RAZONES DE RENTABILIDAD DISCUSIÓN: EL ESTADO DE RESULTADOS A BASE COMÚN TIENE UN EFECTO DESCENDENTE SOBRE LOS CRITERIOS PORCENTUALES, PUES SI BIEN LAS VENTAS NETAS SE CONSIDERAN NUESTRO 100%, SOLO SE CONSIDERAN COSTO DE VENTAS Y UTILIDAD BRUTA, QUE A SU VEZ SE DESGLOSA EN GASTOS DE OPERACION Y UTILIDAD DE OPERACION, ESTE A OTROS GASTOS + U.A.F.I.R. Y ASI CONSECUTIVAMENTE 1) RAZON CIRCULANTE Resultado: Muestra la capacidad de una empresa para cubrir sus pasivos circulantes con sus activos mas disponibles 1.38 2) PRUEBA DEL ACIDO 0.45 Resultado: Permite conocer la capacidad de las empresas de cubrir sus pasivos circulantes con sus activos mas disponibles Variacion 2019-2020 en: Estado a Base Común