SlideShare una empresa de Scribd logo
1 de 13
DILEMAS DE LA EDUCACIÓN UNIVERSITARIA
                      Patricio Meller

                        Contenido

   1.- Costo ES Chile > Mundo => Pq?
   2.- Hyp. Explicativas (4)
   3.- Evol. Costo ES-Chile => h Real Aranceles
   4.- Financiamiento ES
   5.- Marco Conceptual ES
                         Patricio Meller
Relación Aranceles ES/PIB per cápita (2007)
                         0,5

                                                 Chile es el país que tiene un mayor
                         0,4
                                                 costo relativo de la Ed. Superior
Arancel/PIB per cápita


                         0,3


                         0,2


                         0,1


                         0,0
                                Chile   Korea   EE.UU.   Japón Australia Canadá   Reino   España Francia
                                                                                  Unido

                Fuente: OECD (2009)
                                                         Patricio Meller
VPN de la educación superior en Países Desarrolados y Chile
                              (Miles de US$)

                                  Chile                                                               300

                              EE.UU.                                      100

                            Alemania                           64

                                OECD                         52
                                                                          Las Ues. Chilenas son las que
                             Australia                    47
                                                                          tienen mayor valor agregado
                              Canadá               24

                                Korea             21

                              España              20

                               Suecia            17

                                          0             50          100         150   200   250    300       350
                                                                                              Miles de US$


Fuente: OECD (2009), Education at a Glance, valor promedio.
Datos para Chile: Lara, Meller y Valdés (2010), valor mediana carreras.
                                                          Patricio Meller
Inferencias Gráfico Anterior

• V Agreg. Univ Chilenas > VAg Univ Países Desarroll
• Entonces ¿pq Univ Chilenas no están entre las
              50 (100) mejores del mundo?
• ¿Pq no vienen jóvenes EEUU, UE, Asia
       a estudiar/obtener título universitario en Chile?
• ¿Es por problemas de IF? ¿Idioma? ¿Distancia?
• ¿No han visto este Gráfico?
• Obviamente la respuesta es otra

• Metodología: V Agreg Univ se calcula c/r Ed. Media
• V Agreg. Univ Chilenas es alto c/r Ed. Media Chilena
  => Nivel Ed Media en Chile esMeller
                            Patricio
                                     relativamente muy bajo
Tasa de Retorno para Carreras Universitarias
                   seleccionadas a través del Ciclo de Vida

  35%
             30,1%
  30%                27,7%
                             25,8% 25,7% 25,5%
  25%                                            22,2% 21,7%
                                                             21,3% 20,6% 20,2%
                                                                               19,5% 18,9%
  20%                                                                                        17,8%
                                                                                                     16,3%
  15%

  10%

       5%

       0%
                                  .
                                 l

                              ía
                                r
                              al


                              ía
                             nd


                                l


                              ía


                               a
                               a
                               a


                            ho
                             ivi


                              o
                              a
                            ivi
                            to


                           ur
                           in


                           gí
                         sm
                           ic
                           ci


                           er


                          og


                           m
                          C


                          lI
                          di


                          C

                        ec
                        ic
                        er


                        ct
                        lo
                       ás


                      no
                      rm


                      ivi
                     Au


                       ol


                      di
                      g.


                    ed


                     s.


                    ite
                   ico
                  om


                     er

                  .B


                   nt


                  ro
                  fe


                 rio
                   C
                  In


                on


                 D
                M


               qu
                d.


              Ps
              do
              En


              Ag
             Ed
  .C


              g.


             Pe
              C
             ta


           Ar
           O
           In
   g

         on


          d.
In


       Pe
         C


       Fuente: Lara, Meller y Valdés (2010)
                                                   Patricio Meller
Evolución efectiva de los aranceles ES
                     vs Evolución según IPC (1997-2009)
             3.0
Millones $


                   Los aranceles univ. han
             2.5
                   crecido casi un 60% real
             2.0

             1.5

             1.0

             0.5
                        1997                    2000                      2005                2009

                        Privadas R.M. observado                      Privadas R.M. IPC
                        Estatales Regiones observado                 Estatales Regiones IPC

      Fuente: Consejo Superior de Educación y Banco Central

                                                   Patricio Meller
Hay carreras con un aumento
                                                real superior al 120%


Fuente: Consejo Superior de Educación y Banco Central Meller
                                                Patricio
Gasto de los Hogares por Estudiante univ.
                                          como Proporción del PIB per cápita (2006)
                                       0.25
Gasto Hogares por Estudiantes/PIB pc


                                                                      Gasto relativo hogares por
                                        0.2                           Estudiante univ. en Chile
                                       0.15                           es el mayor del mundo

                                        0.1

                                       0.05

                                         0


Fuente: OECD (2009)

                                                           Patricio Meller
Costo de 1 Estudiante univ. supera el 40% del
                      Ingreso familiar en los 3 quintiles menores


                               Patricio Meller
Fuente: CSE y CASEN
Gasto Público en ES como % del PIB
2.0

1.8
                             Gasto público chileno en Ed. Superior
1.6
                             (%PIB) es el menor del mundo
1.4

1.2

1.0

0.8

0.6

0.4


Fuente: OECD (2009)
                              Patricio Meller
Gasto Público por Estudiante como
                                             Proporción del PIB per cápita (2006)
                                       0.5
 Gasto Público por Estudiante/PIB pc


                                             Chile está entre los 3 países con menor Gasto
                                             público por estudiante
                                       0.4


                                       0.3


                                       0.2


Fuente: OECD (2009)
                                                                   Patricio Meller
Relación Gasto Privado/Público en
                        Educación Superior
6
                           Chile es el país con mayor gasto
5
                           privado en Ed. Superior
4
3
2
1
0


Fuente: UNESCO                 Patricio Meller
DILEMAS DE LA EDUCACIÓN UNIVERSITARIA
                      Patricio Meller

                        Contenido

   1.- Costo ES Chile > Mundo => Pq?
   2.- Hyp. Explicativas (4)
   3.- Evol. Costo ES-Chile => h Real Aranceles
   4.- Financiamiento ES
   5.- Marco Conceptual ES
                         Patricio Meller

Más contenido relacionado

Último

FICHA DE LA VIRGEN DE FÁTIMA.pdf educación religiosa primaria de menores
FICHA DE LA VIRGEN DE FÁTIMA.pdf educación religiosa primaria de menoresFICHA DE LA VIRGEN DE FÁTIMA.pdf educación religiosa primaria de menores
FICHA DE LA VIRGEN DE FÁTIMA.pdf educación religiosa primaria de menores
Santosprez2
 
PLAN LECTOR QUINTO 2023 educación primaria de menores Quinto grado
PLAN LECTOR QUINTO 2023  educación primaria de menores Quinto gradoPLAN LECTOR QUINTO 2023  educación primaria de menores Quinto grado
PLAN LECTOR QUINTO 2023 educación primaria de menores Quinto grado
Santosprez2
 
Pasos para enviar una tarea en SIANET - sólo estudiantes.pdf
Pasos para enviar una tarea en SIANET - sólo estudiantes.pdfPasos para enviar una tarea en SIANET - sólo estudiantes.pdf
Pasos para enviar una tarea en SIANET - sólo estudiantes.pdf
NELLYKATTY
 
Estrategia Nacional de Refuerzo Escolar SJA Ccesa007.pdf
Estrategia Nacional de Refuerzo Escolar  SJA  Ccesa007.pdfEstrategia Nacional de Refuerzo Escolar  SJA  Ccesa007.pdf
Estrategia Nacional de Refuerzo Escolar SJA Ccesa007.pdf
Demetrio Ccesa Rayme
 
Apunte clase teorica propiedades de la Madera.pdf
Apunte clase teorica propiedades de la Madera.pdfApunte clase teorica propiedades de la Madera.pdf
Apunte clase teorica propiedades de la Madera.pdf
Gonella
 

Último (20)

FICHA DE LA VIRGEN DE FÁTIMA.pdf educación religiosa primaria de menores
FICHA DE LA VIRGEN DE FÁTIMA.pdf educación religiosa primaria de menoresFICHA DE LA VIRGEN DE FÁTIMA.pdf educación religiosa primaria de menores
FICHA DE LA VIRGEN DE FÁTIMA.pdf educación religiosa primaria de menores
 
El Futuro de la Educacion Digital JS1 Ccesa007.pdf
El Futuro de la Educacion Digital  JS1  Ccesa007.pdfEl Futuro de la Educacion Digital  JS1  Ccesa007.pdf
El Futuro de la Educacion Digital JS1 Ccesa007.pdf
 
POEMAS ILUSTRADOS DE LUÍSA VILLALTA. Elaborados polos alumnos de 4º PDC do IE...
POEMAS ILUSTRADOS DE LUÍSA VILLALTA. Elaborados polos alumnos de 4º PDC do IE...POEMAS ILUSTRADOS DE LUÍSA VILLALTA. Elaborados polos alumnos de 4º PDC do IE...
POEMAS ILUSTRADOS DE LUÍSA VILLALTA. Elaborados polos alumnos de 4º PDC do IE...
 
Lecciones 07 Esc. Sabática. Motivados por la esperanza
Lecciones 07 Esc. Sabática. Motivados por la esperanzaLecciones 07 Esc. Sabática. Motivados por la esperanza
Lecciones 07 Esc. Sabática. Motivados por la esperanza
 
Sesión de clase Motivados por la esperanza.pdf
Sesión de clase Motivados por la esperanza.pdfSesión de clase Motivados por la esperanza.pdf
Sesión de clase Motivados por la esperanza.pdf
 
¿Que es Fuerza? online 2024 Repaso CRECE.pptx
¿Que es Fuerza? online 2024 Repaso CRECE.pptx¿Que es Fuerza? online 2024 Repaso CRECE.pptx
¿Que es Fuerza? online 2024 Repaso CRECE.pptx
 
Los caminos del saber matematicas 7°.pdf
Los caminos del saber matematicas 7°.pdfLos caminos del saber matematicas 7°.pdf
Los caminos del saber matematicas 7°.pdf
 
Power Point : Motivados por la esperanza
Power Point : Motivados por la esperanzaPower Point : Motivados por la esperanza
Power Point : Motivados por la esperanza
 
Motivados por la esperanza. Esperanza en Jesús
Motivados por la esperanza. Esperanza en JesúsMotivados por la esperanza. Esperanza en Jesús
Motivados por la esperanza. Esperanza en Jesús
 
PLAN LECTOR QUINTO 2023 educación primaria de menores Quinto grado
PLAN LECTOR QUINTO 2023  educación primaria de menores Quinto gradoPLAN LECTOR QUINTO 2023  educación primaria de menores Quinto grado
PLAN LECTOR QUINTO 2023 educación primaria de menores Quinto grado
 
novelas-cortas--3.pdf Analisis introspectivo y retrospectivo, sintesis
novelas-cortas--3.pdf Analisis introspectivo y retrospectivo, sintesisnovelas-cortas--3.pdf Analisis introspectivo y retrospectivo, sintesis
novelas-cortas--3.pdf Analisis introspectivo y retrospectivo, sintesis
 
Síndrome piramidal 2024 según alvarez, farrera y wuani
Síndrome piramidal 2024 según alvarez, farrera y wuaniSíndrome piramidal 2024 según alvarez, farrera y wuani
Síndrome piramidal 2024 según alvarez, farrera y wuani
 
cuadernillo_cuentos_de_los_valores_elprofe20 (1).docx
cuadernillo_cuentos_de_los_valores_elprofe20 (1).docxcuadernillo_cuentos_de_los_valores_elprofe20 (1).docx
cuadernillo_cuentos_de_los_valores_elprofe20 (1).docx
 
Pasos para enviar una tarea en SIANET - sólo estudiantes.pdf
Pasos para enviar una tarea en SIANET - sólo estudiantes.pdfPasos para enviar una tarea en SIANET - sólo estudiantes.pdf
Pasos para enviar una tarea en SIANET - sólo estudiantes.pdf
 
4. MATERIALES QUE SE EMPLEAN EN LAS ESTRUCTURAS.pptx
4. MATERIALES QUE SE EMPLEAN EN LAS ESTRUCTURAS.pptx4. MATERIALES QUE SE EMPLEAN EN LAS ESTRUCTURAS.pptx
4. MATERIALES QUE SE EMPLEAN EN LAS ESTRUCTURAS.pptx
 
Estrategia Nacional de Refuerzo Escolar SJA Ccesa007.pdf
Estrategia Nacional de Refuerzo Escolar  SJA  Ccesa007.pdfEstrategia Nacional de Refuerzo Escolar  SJA  Ccesa007.pdf
Estrategia Nacional de Refuerzo Escolar SJA Ccesa007.pdf
 
REGLAMENTO FINAL DE EVALUACIÓN 2024 pdf.pdf
REGLAMENTO  FINAL DE EVALUACIÓN 2024 pdf.pdfREGLAMENTO  FINAL DE EVALUACIÓN 2024 pdf.pdf
REGLAMENTO FINAL DE EVALUACIÓN 2024 pdf.pdf
 
Realitat o fake news? – Què causa el canvi climàtic? - La desertització
Realitat o fake news? – Què causa el canvi climàtic? - La desertitzacióRealitat o fake news? – Què causa el canvi climàtic? - La desertització
Realitat o fake news? – Què causa el canvi climàtic? - La desertització
 
Apunte clase teorica propiedades de la Madera.pdf
Apunte clase teorica propiedades de la Madera.pdfApunte clase teorica propiedades de la Madera.pdf
Apunte clase teorica propiedades de la Madera.pdf
 
Botiquin del amor - Plantillas digitales.pdf
Botiquin del amor - Plantillas digitales.pdfBotiquin del amor - Plantillas digitales.pdf
Botiquin del amor - Plantillas digitales.pdf
 

Destacado

Social Media Marketing Trends 2024 // The Global Indie Insights
Social Media Marketing Trends 2024 // The Global Indie InsightsSocial Media Marketing Trends 2024 // The Global Indie Insights
Social Media Marketing Trends 2024 // The Global Indie Insights
Kurio // The Social Media Age(ncy)
 

Destacado (20)

AI Trends in Creative Operations 2024 by Artwork Flow.pdf
AI Trends in Creative Operations 2024 by Artwork Flow.pdfAI Trends in Creative Operations 2024 by Artwork Flow.pdf
AI Trends in Creative Operations 2024 by Artwork Flow.pdf
 
Skeleton Culture Code
Skeleton Culture CodeSkeleton Culture Code
Skeleton Culture Code
 
PEPSICO Presentation to CAGNY Conference Feb 2024
PEPSICO Presentation to CAGNY Conference Feb 2024PEPSICO Presentation to CAGNY Conference Feb 2024
PEPSICO Presentation to CAGNY Conference Feb 2024
 
Content Methodology: A Best Practices Report (Webinar)
Content Methodology: A Best Practices Report (Webinar)Content Methodology: A Best Practices Report (Webinar)
Content Methodology: A Best Practices Report (Webinar)
 
How to Prepare For a Successful Job Search for 2024
How to Prepare For a Successful Job Search for 2024How to Prepare For a Successful Job Search for 2024
How to Prepare For a Successful Job Search for 2024
 
Social Media Marketing Trends 2024 // The Global Indie Insights
Social Media Marketing Trends 2024 // The Global Indie InsightsSocial Media Marketing Trends 2024 // The Global Indie Insights
Social Media Marketing Trends 2024 // The Global Indie Insights
 
Trends In Paid Search: Navigating The Digital Landscape In 2024
Trends In Paid Search: Navigating The Digital Landscape In 2024Trends In Paid Search: Navigating The Digital Landscape In 2024
Trends In Paid Search: Navigating The Digital Landscape In 2024
 
5 Public speaking tips from TED - Visualized summary
5 Public speaking tips from TED - Visualized summary5 Public speaking tips from TED - Visualized summary
5 Public speaking tips from TED - Visualized summary
 
ChatGPT and the Future of Work - Clark Boyd
ChatGPT and the Future of Work - Clark Boyd ChatGPT and the Future of Work - Clark Boyd
ChatGPT and the Future of Work - Clark Boyd
 
Getting into the tech field. what next
Getting into the tech field. what next Getting into the tech field. what next
Getting into the tech field. what next
 
Google's Just Not That Into You: Understanding Core Updates & Search Intent
Google's Just Not That Into You: Understanding Core Updates & Search IntentGoogle's Just Not That Into You: Understanding Core Updates & Search Intent
Google's Just Not That Into You: Understanding Core Updates & Search Intent
 
How to have difficult conversations
How to have difficult conversations How to have difficult conversations
How to have difficult conversations
 
Introduction to Data Science
Introduction to Data ScienceIntroduction to Data Science
Introduction to Data Science
 
Time Management & Productivity - Best Practices
Time Management & Productivity -  Best PracticesTime Management & Productivity -  Best Practices
Time Management & Productivity - Best Practices
 
The six step guide to practical project management
The six step guide to practical project managementThe six step guide to practical project management
The six step guide to practical project management
 
Beginners Guide to TikTok for Search - Rachel Pearson - We are Tilt __ Bright...
Beginners Guide to TikTok for Search - Rachel Pearson - We are Tilt __ Bright...Beginners Guide to TikTok for Search - Rachel Pearson - We are Tilt __ Bright...
Beginners Guide to TikTok for Search - Rachel Pearson - We are Tilt __ Bright...
 
Unlocking the Power of ChatGPT and AI in Testing - A Real-World Look, present...
Unlocking the Power of ChatGPT and AI in Testing - A Real-World Look, present...Unlocking the Power of ChatGPT and AI in Testing - A Real-World Look, present...
Unlocking the Power of ChatGPT and AI in Testing - A Real-World Look, present...
 
12 Ways to Increase Your Influence at Work
12 Ways to Increase Your Influence at Work12 Ways to Increase Your Influence at Work
12 Ways to Increase Your Influence at Work
 
ChatGPT webinar slides
ChatGPT webinar slidesChatGPT webinar slides
ChatGPT webinar slides
 
More than Just Lines on a Map: Best Practices for U.S Bike Routes
More than Just Lines on a Map: Best Practices for U.S Bike RoutesMore than Just Lines on a Map: Best Practices for U.S Bike Routes
More than Just Lines on a Map: Best Practices for U.S Bike Routes
 

Dilemas de la educacion universitaria (Patricio Meller, Facultad de Ingeniería Industrial - Universidad de Chile)

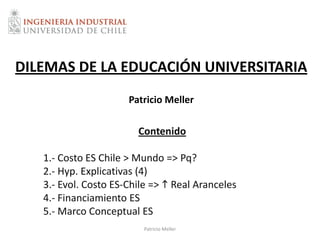
  • 1. DILEMAS DE LA EDUCACIÓN UNIVERSITARIA Patricio Meller Contenido 1.- Costo ES Chile > Mundo => Pq? 2.- Hyp. Explicativas (4) 3.- Evol. Costo ES-Chile => h Real Aranceles 4.- Financiamiento ES 5.- Marco Conceptual ES Patricio Meller
  • 2. Relación Aranceles ES/PIB per cápita (2007) 0,5 Chile es el país que tiene un mayor 0,4 costo relativo de la Ed. Superior Arancel/PIB per cápita 0,3 0,2 0,1 0,0 Chile Korea EE.UU. Japón Australia Canadá Reino España Francia Unido Fuente: OECD (2009) Patricio Meller
  • 3. VPN de la educación superior en Países Desarrolados y Chile (Miles de US$) Chile 300 EE.UU. 100 Alemania 64 OECD 52 Las Ues. Chilenas son las que Australia 47 tienen mayor valor agregado Canadá 24 Korea 21 España 20 Suecia 17 0 50 100 150 200 250 300 350 Miles de US$ Fuente: OECD (2009), Education at a Glance, valor promedio. Datos para Chile: Lara, Meller y Valdés (2010), valor mediana carreras. Patricio Meller
  • 4. Inferencias Gráfico Anterior • V Agreg. Univ Chilenas > VAg Univ Países Desarroll • Entonces ¿pq Univ Chilenas no están entre las 50 (100) mejores del mundo? • ¿Pq no vienen jóvenes EEUU, UE, Asia a estudiar/obtener título universitario en Chile? • ¿Es por problemas de IF? ¿Idioma? ¿Distancia? • ¿No han visto este Gráfico? • Obviamente la respuesta es otra • Metodología: V Agreg Univ se calcula c/r Ed. Media • V Agreg. Univ Chilenas es alto c/r Ed. Media Chilena => Nivel Ed Media en Chile esMeller Patricio relativamente muy bajo
  • 5. Tasa de Retorno para Carreras Universitarias seleccionadas a través del Ciclo de Vida 35% 30,1% 30% 27,7% 25,8% 25,7% 25,5% 25% 22,2% 21,7% 21,3% 20,6% 20,2% 19,5% 18,9% 20% 17,8% 16,3% 15% 10% 5% 0% . l ía r al ía nd l ía a a a ho ivi o a ivi to ur in gí sm ic ci er og m C lI di C ec ic er ct lo ás no rm ivi Au ol di g. ed s. ite ico om er .B nt ro fe rio C In on D M qu d. Ps do En Ag Ed .C g. Pe C ta Ar O In g on d. In Pe C Fuente: Lara, Meller y Valdés (2010) Patricio Meller
  • 6. Evolución efectiva de los aranceles ES vs Evolución según IPC (1997-2009) 3.0 Millones $ Los aranceles univ. han 2.5 crecido casi un 60% real 2.0 1.5 1.0 0.5 1997 2000 2005 2009 Privadas R.M. observado Privadas R.M. IPC Estatales Regiones observado Estatales Regiones IPC Fuente: Consejo Superior de Educación y Banco Central Patricio Meller
  • 7. Hay carreras con un aumento real superior al 120% Fuente: Consejo Superior de Educación y Banco Central Meller Patricio
  • 8. Gasto de los Hogares por Estudiante univ. como Proporción del PIB per cápita (2006) 0.25 Gasto Hogares por Estudiantes/PIB pc Gasto relativo hogares por 0.2 Estudiante univ. en Chile 0.15 es el mayor del mundo 0.1 0.05 0 Fuente: OECD (2009) Patricio Meller
  • 9. Costo de 1 Estudiante univ. supera el 40% del Ingreso familiar en los 3 quintiles menores Patricio Meller Fuente: CSE y CASEN
  • 10. Gasto Público en ES como % del PIB 2.0 1.8 Gasto público chileno en Ed. Superior 1.6 (%PIB) es el menor del mundo 1.4 1.2 1.0 0.8 0.6 0.4 Fuente: OECD (2009) Patricio Meller
  • 11. Gasto Público por Estudiante como Proporción del PIB per cápita (2006) 0.5 Gasto Público por Estudiante/PIB pc Chile está entre los 3 países con menor Gasto público por estudiante 0.4 0.3 0.2 Fuente: OECD (2009) Patricio Meller
  • 12. Relación Gasto Privado/Público en Educación Superior 6 Chile es el país con mayor gasto 5 privado en Ed. Superior 4 3 2 1 0 Fuente: UNESCO Patricio Meller
  • 13. DILEMAS DE LA EDUCACIÓN UNIVERSITARIA Patricio Meller Contenido 1.- Costo ES Chile > Mundo => Pq? 2.- Hyp. Explicativas (4) 3.- Evol. Costo ES-Chile => h Real Aranceles 4.- Financiamiento ES 5.- Marco Conceptual ES Patricio Meller