

Recomendados
Más contenido relacionado
Destacado
Similar a Analytics iagua.es 20111010_(dashboard_report)
Similar a Analytics iagua.es 20111010_(dashboard_report) (11)
Más de iAgua .es
Más de iAgua .es (20)
Analytics iagua.es 20111010_(dashboard_report)
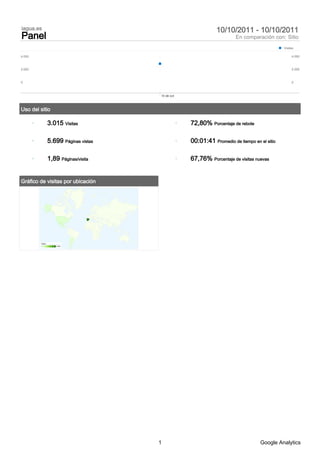
- 1. iagua.es 10/10/2011 - 10/10/2011 Panel En comparación con: Sitio Visitas 4.000 4.000 2.000 2.000 0 0 10 de oct Uso del sitio 3.015 Visitas 72,80% Porcentaje de rebote 5.699 Páginas vistas 00:01:41 Promedio de tiempo en el sitio 1,89 Páginas/visita 67,76% Porcentaje de visitas nuevas Gráfico de visitas por ubicación Visitas 1 2.538 1 Google Analytics
- 2. iagua.es 10/10/2011 - 10/10/2011 Gráfico de visitas por ubicación En comparación con: Sitio Visitas 1 2.538 3.015 visitas de 52 países/territorios Uso del sitio Visitas Páginas/visita Promedio de tiempo Porcentaje de visitas Porcentaje de rebote en el sitio nuevas 3.015 1,89 72,80% Porcentaje del total del Promedio del sitio: 00:01:41 67,96% Promedio del sitio: sitio: 1,89 (0,00%) Promedio del sitio: Promedio del sitio: 72,80% (0,00%) 100,00% 00:01:41 (0,00%) 67,76% (0,29%) País/territorio Visitas Páginas/visita Promedio de Porcentaje de Porcentaje de tiempo en el visitas nuevas rebote sitio Spain 2.538 1,95 00:01:46 65,72% 71,95% Mexico 150 1,41 00:01:08 86,67% 76,67% (not set) 36 1,67 00:01:28 75,00% 75,00% United States 35 1,09 00:00:10 88,57% 91,43% Argentina 29 1,52 00:01:39 79,31% 68,97% Peru 24 1,29 00:00:53 87,50% 87,50% United Kingdom 23 2,17 00:01:44 60,87% 73,91% Germany 21 1,48 00:00:39 66,67% 80,95% Colombia 19 1,16 00:00:28 63,16% 78,95% Ecuador 16 1,31 00:02:13 81,25% 81,25% 1 - 10 de 52 2 Google Analytics