Evolution of transfusion in NAVARRA
•
0 likes•210 views

Evolution fo donation and transfusion. Preliminar impact of educational measures Need of Patient blood Managemente
Recommended

Recommended
More Related Content
Similar to Evolution of transfusion in NAVARRA
Similar to Evolution of transfusion in NAVARRA (20)
More from José Antonio García Erce
More from José Antonio García Erce (20)
Recently uploaded
Recently uploaded (20)
Evolution of transfusion in NAVARRA
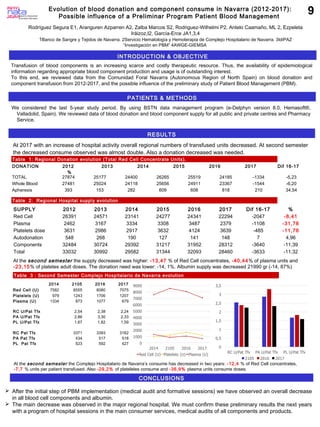
- 1. We considered the last 5-year study period. By using BSTN data management program (e-Delphyn version 8.0, Hemasoft®, Valladolid, Spain). We reviewed data of blood donation and blood component supply for all public and private centres and Pharmacy Service. Transfusion of blood components is an increasing scarce and costly therapeutic resource. Thus, the availability of epidemiological information regarding appropriate blood component production and usage is of outstanding interest. To this end, we reviewed data from the Comunidad Foral Navarra (Autonomous Region of North Spain) on blood donation and component transfusion from 2012-2017, and the possible influence of the preliminary study of Patient Blood Management (PBM). Evolution of blood donation and component consume in Navarra (2012-2017): Possible influence of a Preliminar Program Patient Blood Management Rodríguez Segura E1, Aranguren Azparren A2, Zalba Marcos S2, Rodriguez-Wilhelmi P2, Antelo Caamaño, ML 2, Ezpeleta Iráizoz,I2, García-Erce JA1,3,4 1Banco de Sangre y Tejidos de Navarra. 2Servicio Hematología y Hemoterapia de Complejo Hospitalario de Navarra. 3IdiPAZ “Investigación en PBM” 4AWGE-GIEMSA INTRODUCTION & OBJECTIVE PATIENTS & METHODS RESULTS After the initial step of PBM implementation (medical audit and formative sessions) we have observed an overall decrease in all blood cell components and albumin. The main decrease was observed in the major regional hospital. We must confirm these preliminary results the next years with a program of hospital sessions in the main consumer services, medical audits of all components and products. CONCLUSIONS At 2017 with an increase of hospital activity overall regional numbers of transfused units decreased. At second semester the decreased consume observed was almost double. Also a donation decreased was needed. Table 1: Regional Donation evolution (Total Red Cell Concentrate Units). 9 Table 2: Regional Hospital supply evolution At the second semester the supply decreased was higher: -13,47 % of Red Cell concentrates, -40,44% of plasma units and -23,15% of platetes adult doses. The donation need was lower: -14, 1%. Albumin supply was decreased 21990 gr (-14, 87%) DONATION 2012 2013 2014 2015 2016 2017 Dif 16-17 % TOTAL 27874 25177 24400 26265 25519 24185 -1334 -5,23 Whole Blood 27481 25024 24118 25656 24911 23367 -1544 -6,20 Apheresis 393 153 282 609 608 818 210 34,54 SUPPLY 2012 2013 2014 2015 2016 2017 Dif 16-17 % Red Cell 26391 24571 23141 24277 24341 22294 -2047 -8,41 Plasma 2462 3167 3334 3308 3487 2379 -1108 -31,78 Platelets dose 3631 2986 2917 3632 4124 3639 -485 -11,76 Autodonation 548 268 190 127 141 148 7 4,96 Components 32484 30724 29392 31217 31952 28312 -3640 -11,39 Total 33032 30992 29582 31344 32093 28460 -3633 -11,32 2014 2105 2016 2017 Red Cell (U) 7582 8555 8080 7075 Platelets (U) 979 1243 1706 1207 Plasma (U) 1334 873 1077 679 RC U/Pat Tfx 2,54 2,38 2,24 PA U/Pat Tfx 2,86 3,30 2,33 PL U/Pat Tfx 1,67 1,82 1,59 RC Pat Tfx 3371 3393 3162 PA Pat Tfx 434 517 518 PL Pat Tfx 523 592 427 Table 3 : Second Semester Complejo Hospitalario de Navarra evolution At the second semester the Complejo Hospitalario de Navarra’s consume has decreased in two years: -12,4 % of Red Cell concentrates, -7,7 % units per patient transfused. Also -29,2% of plateletes consume and -36,9% plasma units consume doses.