Seminario de Tesis II - 4ta clase
•Descargar como DOC, PDF•
0 recomendaciones•563 vistas

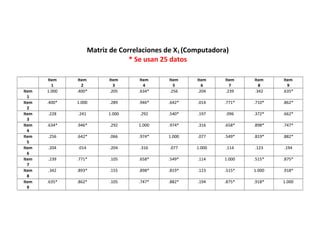
La matriz de correlaciones muestra las correlaciones entre 9 ítems (X1) utilizando 25 datos. Se calcula el coeficiente de correlación de Pearson para cada par de ítems. La mayoría de las correlaciones son bajas o medias, entre 0.2 y 0.6, lo que indica una asociación débil a moderada entre los ítems.

Recomendados
Más contenido relacionado
Destacado
Destacado (17)
Más de Free TIC
Más de Free TIC (20)
Último
Último (20)
Seminario de Tesis II - 4ta clase
- 1. Matriz de Correlaciones de X1 (Computadora) * Se usan 25 datos Item 1 Item 2 Item 3 Item 4 Item 5 Item 6 Item 7 Item 8 Item 9 Item 1 1.000 .400* .205 .634* .256 .204 .239 .342 .635* Item 2 .400* 1.000 .289 .946* .642* .014 .771* .710* .862* Item 3 .228 .241 1.000 .292 .540* .197 .096 .372* .662* Item 4 .634* .946* .292 1.000 .974* .316 .658* .898* .747* Item 5 .256 .642* .066 .974* 1.000 .077 .549* .819* .882* Item 6 .204 .014 .204 .316 .077 1.000 .114 .123 .194 Item 7 .239 .771* .105 .658* .549* .114 1.000 .515* .875* Item 8 .342 .893* .155 .898* .819* .123 .515* 1.000 .918* Item 9 .635* .862* .105 .747* .882* .194 .875* .918* 1.000
- 2. Aplicando el Coeficiente de Correlación de Pearson: n= numero de ítems: 25 = Σ I1 = 110 = Σ I2 = 109 = Σ I1 2 = 490 = Σ I2 2 = 487 = Σ I1 x I2 = 483 Reemplazando: r= 25 x 483– 110 x 109 . 25 (490) – (110)2 25 (487) – (109)2 r= 12075– 11990 . 12250 – 12100 12175 – 11881 r= 85 . = 84 . = 84 . = 0.400 150 294 44100 210 1 2 3 4 5 6 7 8 9 10 11 12 13 14 15 16 17 18 19 20 21 22 23 24 25 Σ I1 5 4 4 5 4 4 4 5 4 5 4 4 4 5 4 4 5 4 5 4 5 5 4 5 4 110 I2 4 4 3 5 4 4 4 5 4 5 4 5 3 5 4 5 5 4 5 5 3 5 5 5 4 109 I1 2 25 16 16 25 16 16 16 25 16 25 16 16 16 25 16 16 25 16 25 16 25 25 16 25 16 490 I2 2 16 16 9 25 16 16 16 25 16 25 16 25 9 25 16 25 25 16 25 25 9 25 25 25 16 487 I1 x I2 20 16 12 25 16 16 16 25 16 25 16 20 12 25 16 20 25 16 25 20 15 25 20 25 16 483 Intervalos de correlación Valoración 0.20- 0.40 0.41- 0.60 0.61- 0.80 0.81- 0.99 Correlación baja Correlación media Correlación alta Correlación altísima Correlación baja I1-I2 I2-I1
- 3. Aplicando el Coeficiente de Correlación de Pearson: n= numero de ítems: 25 = Σ I1 = 110 = Σ I3 = 109 = Σ I1 2 = 490 = Σ I3 2 = 483 = Σ I1 x I3 = 481 Reemplazando: r= 25 x 481 – 110 x 109 . 25 (490) – (110)2 25 (483) – (109)2 r= 12025 – 11990 . 12250– 12100 12075 – 11881 r= 35 . = 35 . = 35 . = 0,205 150 194 29100 170.587 1 2 3 4 5 6 7 8 9 10 11 12 13 14 15 16 17 18 19 20 21 22 23 24 25 Σ I1 5 4 4 5 4 4 4 5 4 5 4 4 4 5 4 4 5 4 5 4 5 5 4 5 4 110 I3 4 5 4 4 5 5 4 5 4 4 4 5 4 5 4 4 5 5 5 4 4 5 4 4 3 109 I1 2 25 16 16 25 16 16 16 25 16 25 16 16 16 25 16 16 25 16 25 16 25 25 16 25 16 490 I3 2 16 25 16 16 25 25 16 25 16 16 16 25 16 25 16 16 25 25 25 16 16 25 16 16 9 483 I1 x I3 20 20 16 20 20 20 16 25 16 20 16 20 16 25 16 16 25 20 25 16 20 25 16 20 12 481 Correlación baja I1-I3 I3-I1
- 4. Intervalos de correlación Valoración 0.20- 0.40 0.41- 0.60 0.61- 0.80 0.81- 0.99 Correlación baja Correlación media Correlación alta Correlación altísima
- 5. Aplicando el Coeficiente de Correlación de Pearson: n= numero de ítems: 25 = Σ I1 = 110 = Σ I4 = 112 = Σ I1 2 = 490 = Σ I4 2 = 506 = Σ I1 x I4 = 496 Reemplazando: r= 25 x 496 – 110 x 112 . 25 (490) – (110)2 25 (506) – (112)2 r= 12400 – 12320 . 12250– 12100 12650 – 12544 r= 80 . = 80 = 80 . = 0.634 150 106 15900 126.095 1 2 3 4 5 6 7 8 9 10 11 12 13 14 15 16 17 18 19 20 21 22 23 24 25 Σ I1 5 4 4 5 4 4 4 5 4 5 4 4 4 5 4 4 5 4 5 4 5 5 4 5 4 110 I4 5 4 4 5 4 4 4 5 4 5 4 5 5 5 4 4 5 4 5 5 3 5 5 5 4 112 I1 2 25 16 16 25 16 16 16 25 16 25 16 16 16 25 16 16 25 16 25 16 25 25 16 25 16 490 I4 2 25 16 16 25 16 16 16 25 16 25 16 25 25 25 16 16 25 16 25 20 15 25 20 25 16 506 I1 x I4 25 16 16 25 16 16 16 25 16 25 16 20 20 25 16 16 25 16 25 20 15 25 20 25 16 496 Correlación media I1-I4 I4-I1
- 6. Intervalos de correlación Valoración 0.20- 0.40 0.41- 0.60 0.61- 0.80 0.81- 0.99 Correlación baja Correlación media Correlación alta Correlación altísima
- 7. Aplicando el Coeficiente de Correlación de Pearson: n= numero de ítems: 25 = Σ I1 = 110 = Σ I5 = 113 = Σ I1 2 = 490 = Σ I5 2 = 519 = Σ I1 x I5 = 499 Reemplazando: r= 25 x 499– 110 x 113 . 25 (490) – (110)2 25 (519) – (113)2 r= 12475– 12430 . 12250 – 12100 12975 – 12769 r= 45 . = 45 . = 45 . = 0.256 150 206 30900 175.784 1 2 3 4 5 6 7 8 9 10 11 12 13 14 15 16 17 18 19 20 21 22 23 24 25 Σ I1 5 4 4 5 4 4 4 5 4 5 4 4 4 5 4 4 5 4 5 4 5 5 4 5 4 110 I5 5 4 4 5 4 4 4 5 4 5 4 5 5 5 4 5 5 4 5 5 3 4 5 5 5 113 I1 2 25 16 16 25 16 16 16 25 16 25 16 16 16 25 16 16 25 16 25 16 25 25 16 25 16 490 I5 2 25 16 16 25 16 16 16 25 16 25 16 25 25 25 16 25 25 16 25 25 9 16 25 25 25 519 I1 x I5 25 16 16 25 16 16 16 25 16 25 16 20 20 25 16 20 25 16 25 20 15 20 20 25 20 499 Correlación baja I1-I5 I5-I1
- 8. Intervalos de correlación Valoración 0.20- 0.40 0.41- 0.60 0.61- 0.80 0.81- 0.99 Correlación baja Correlación media Correlación alta Correlación altísima
- 9. Aplicando el Coeficiente de Correlación de Pearson: n= numero de ítems: 25 = Σ I1 = 110 = Σ I6 = 105 = Σ I1 2 = 490 = Σ I6 2 = 457 = Σ I1 x I6 = 464 Reemplazando: r= 25 x 464 – 110 x 105 . 25 (490) – (110)2 25 (457) – (105)2 r= 11600 – 11550 . 12250– 12100 11425 – 11025 r= 50 . = 50 = 50 . = 0,204 150 400 60000 244.949 1 2 3 4 5 6 7 8 9 10 11 12 13 14 15 16 17 18 19 20 21 22 23 24 25 Σ I1 5 4 4 5 4 4 4 5 4 5 4 4 4 5 4 4 5 4 5 4 5 5 4 5 4 110 I6 4 5 5 4 4 4 4 4 3 5 4 4 4 5 3 3 4 5 5 4 4 5 4 4 5 105 I1 2 25 16 16 25 16 16 16 25 16 25 16 16 16 25 16 16 25 16 25 16 25 25 16 25 16 490 I6 2 16 25 25 16 16 16 16 16 9 25 16 16 16 25 15 9 16 25 25 16 16 25 16 16 25 457 I1 x I6 20 20 20 20 16 16 16 20 12 25 16 16 16 25 12 12 20 20 25 16 20 25 16 20 20 464 Correlación baja I1-I6 I6-I1
- 10. Intervalos de correlación Valoración 0.20- 0.40 0.41- 0.60 0.61- 0.80 0.81- 0.99 Correlación baja Correlación media Correlación alta Correlación altísima
- 11. Aplicando el Coeficiente de Correlación de Pearson: n= numero de ítems: 25 = Σ I1 = 110 = Σ I7 = 108 = Σ I1 2 = 490 = Σ I7 2 = 476 = Σ I1 x I5 = 477 Reemplazando: r= 25 x 477– 110 x 108 . 25 (490) – (110)2 25 (476) – (108)2 r= 11925– 11880 . 12250 – 12100 11900 – 11664 r= 45 . = 45 . = 45 . = 0.239 150 236 35400 188.149 1 2 3 4 5 6 7 8 9 10 11 12 13 14 15 16 17 18 19 20 21 22 23 24 25 Σ I1 5 4 4 5 4 4 4 5 4 5 4 4 4 5 4 4 5 4 5 4 5 5 4 5 4 110 I7 4 5 4 5 4 4 4 5 4 5 4 4 3 5 4 5 4 4 5 5 3 4 5 5 4 108 I1 2 25 16 16 25 16 16 16 25 16 25 16 16 16 25 16 16 25 16 25 16 25 25 16 25 16 490 I7 2 16 25 16 25 16 16 16 25 16 25 16 16 9 25 16 25 16 16 25 25 9 16 25 25 16 476 I1 x I7 20 20 16 25 16 16 16 25 16 25 16 16 12 25 16 20 20 16 25 20 15 20 20 25 16 477 Correlación baja I1-I7 I7-I1
- 12. Intervalos de correlación Valoración 0.20- 0.40 0.41- 0.60 0.61- 0.80 0.81- 0.99 Correlación baja Correlación media Correlación alta Correlación altísima
- 13. Aplicando el Coeficiente de Correlación de Pearson: n= numero de ítems: 25 = Σ I1 = 110 = Σ I8 = 114 = Σ I1 2 = 490 = Σ I8 2 = 528 = Σ I1 x I8 = 504 Reemplazando: r= 25 x 504– 110 x 114 . 25 (490) – (110)2 25 (528) – (114)2 r= 12600– 12540 . 12250 – 12100 13200 – 12996 r= 60 . = 60 . = 60 . = 0.342 150 204 30600 174.928 1 2 3 4 5 6 7 8 9 10 11 12 13 14 15 16 17 18 19 20 21 22 23 24 25 Σ I1 5 4 4 5 4 4 4 5 4 5 4 4 4 5 4 4 5 4 5 4 5 5 4 5 4 110 I8 5 4 4 5 4 4 4 5 4 5 4 5 5 5 4 5 5 4 5 5 3 5 5 5 5 114 I1 2 25 16 16 25 16 16 16 25 16 25 16 16 16 25 16 16 25 16 25 16 25 25 16 25 16 490 I8 2 25 16 16 25 16 16 16 25 16 25 16 25 25 25 16 25 25 16 25 25 9 25 25 25 25 528 I1 x I8 25 16 16 25 16 16 16 25 16 25 16 20 20 25 16 20 25 16 25 20 15 25 20 25 20 504 Correlación baja I1-I8 I8-I1
- 14. Intervalos de correlación Valoración 0.20- 0.40 0.41- 0.60 0.61- 0.80 0.81- 0.99 Correlación baja Correlación media Correlación alta Correlación altísima
- 15. Aplicando el Coeficiente de Correlación de Pearson: n= numero de ítems: 25 = Σ I1 = 110 = Σ I9 = 113 = Σ I1 2 = 490 = Σ I9 2 = 514 = Σ I1 x I9 = 498 Reemplazando: r= 25 x 498– 110 x 113 . 25 (490) – (110)2 25 (514) – (113)2 r= 12450– 12430 . 12250 – 12100 12850 – 12769 r= 20 . = 20 . = 70 . = 0.635 150 81 12150 110.227 1 2 3 4 5 6 7 8 9 10 11 12 13 14 15 16 17 18 19 20 21 22 23 24 25 Σ I1 5 4 4 5 4 4 4 5 4 5 4 4 4 5 4 4 5 4 5 4 5 5 4 5 4 110 I9 5 5 4 5 4 4 4 4 4 5 4 5 5 5 4 5 5 4 5 5 3 4 5 5 5 113 I1 2 25 16 16 25 16 16 16 25 16 25 16 16 16 25 16 16 25 16 25 16 25 25 16 25 16 490 I9 2 25 25 16 25 16 16 16 16 16 25 16 25 25 25 16 25 25 16 25 25 9 16 25 25 20 514 I1 x I9 25 20 16 25 16 16 16 20 16 25 16 20 20 25 16 20 25 16 25 20 15 20 20 25 20 498 Correlación alta I1-I9 I9-I1
- 16. Intervalos de correlación Valoración 0.20- 0.40 0.41- 0.60 0.61- 0.80 0.81- 0.99 Correlación baja Correlación media Correlación alta Correlación altísima
- 17. Aplicando el Coeficiente de Correlación de Pearson: n= numero de ítems: 25 = Σ I2 = 109 = Σ I3 = 109 = Σ I2 2 = 487 = Σ I3 2 = 483 = Σ I2 x I3 = 478 Reemplazando: r= 25 x 478– 109 x 109 . 25 (487) – (109)2 25 (483) – (109)2 r= 11950– 11881 . 12175 – 11881 12075 – 11881 r= 69 . = 69 . = 69 . = 0.289 294 194 57036 238.822 1 2 3 4 5 6 7 8 9 10 11 12 13 14 15 16 17 18 19 20 21 22 23 24 25 Σ I2 4 4 3 5 4 4 4 5 4 5 4 5 3 5 4 5 5 4 5 5 3 5 5 5 4 109 I3 4 5 4 4 5 5 4 5 4 4 4 5 4 5 4 4 5 5 5 4 4 5 4 4 3 109 I2 2 16 16 9 25 16 16 16 25 16 25 16 25 9 25 16 25 25 16 25 25 9 25 25 25 16 487 I3 2 16 25 16 16 25 25 16 25 16 16 16 25 16 25 16 16 25 25 25 16 16 25 16 16 9 483 I2x I3 16 20 12 20 20 20 16 25 16 20 16 25 12 25 16 20 25 20 25 20 12 25 20 20 12 478 Correlación baja I2-I3 I3-I2
- 18. Intervalos de correlación Valoración 0.20- 0.40 0.41- 0.60 0.61- 0.80 0.81- 0.99 Correlación baja Correlación media Correlación alta Correlación altísima
- 19. Aplicando el Coeficiente de Correlación de Pearson: n= numero de ítems: 25 = Σ I2 = 109 = Σ I4 = 112 = Σ I2 2 = 487 = Σ I4 2 = 506 = Σ I2 x I4 = 495 Reemplazando: r= 25 x 495– 109 x 112 . 25 (487) – (109)2 25 (506) – (112)2 r= 12375– 12208 . 12175 – 11881 12650 – 12544 r= 167 . = 167 . = 167 . = 0.946 294 106 31164 176.533 1 2 3 4 5 6 7 8 9 10 11 12 13 14 15 16 17 18 19 20 21 22 23 24 25 Σ I2 4 4 3 5 4 4 4 5 4 5 4 5 3 5 4 5 5 4 5 5 3 5 5 5 4 109 I4 5 4 4 5 4 4 4 5 4 5 4 5 5 5 4 4 5 4 5 5 3 5 5 5 4 112 I2 2 16 16 9 25 16 16 16 25 16 25 16 25 9 25 16 25 25 16 25 25 9 25 25 25 16 487 I4 2 25 16 16 25 16 16 16 25 16 25 16 25 25 25 16 16 25 16 25 20 15 25 20 25 16 506 I2x I4 20 16 12 25 16 16 16 25 16 25 16 25 15 25 16 20 25 16 25 25 9 25 25 25 16 495 Correlación altísima I2-I4 I4-I2
- 20. Intervalos de correlación Valoración 0.20- 0.40 0.41- 0.60 0.61- 0.80 0.81- 0.99 Correlación baja Correlación media Correlación alta Correlación altísima
- 21. Aplicando el Coeficiente de Correlación de Pearson: n= numero de ítems: 25 = Σ I2 = 109 = Σ I5 = 113 = Σ I2 2 = 487 = Σ I5 2 = 519 = Σ I2 x I5 = 499 Reemplazando: r= 25 x 499– 109 x 113 . 25 (487) – (109)2 25 (519) – (113)2 r= 12475– 12317 . 12175 – 11881 12975 – 12769 r= 158 . = 158 . = 158 . = 0.642 294 206 60564 246.098 1 2 3 4 5 6 7 8 9 10 11 12 13 14 15 16 17 18 19 20 21 22 23 24 25 Σ I2 4 4 3 5 4 4 4 5 4 5 4 5 3 5 4 5 5 4 5 5 3 5 5 5 4 109 I5 5 4 4 5 4 4 4 5 4 5 4 5 5 5 4 5 5 4 5 5 3 4 5 5 5 113 I2 2 16 16 9 25 16 16 16 25 16 25 16 25 9 25 16 25 25 16 25 25 9 25 25 25 16 487 I5 2 25 16 16 25 16 16 16 25 16 25 16 25 25 25 16 25 25 16 25 25 9 16 25 25 25 519 I2x I5 20 16 12 25 16 16 16 25 16 25 16 25 15 25 16 25 25 16 25 25 9 20 25 25 20 499 Correlación alta I2-I5 I5-I2
- 22. Intervalos de correlación Valoración 0.20- 0.40 0.41- 0.60 0.61- 0.80 0.81- 0.99 Correlación baja Correlación media Correlación alta Correlación altísima
- 23. Aplicando el Coeficiente de Correlación de Pearson: n= numero de ítems: 25 = Σ I2 = 109 = Σ I6 = 105 = Σ I2 2 = 487 = Σ I6 2 = 457 = Σ I2 x I6 = 458 Reemplazando: r= 25 x 458– 109 x 105 . 25 (487) – (109)2 25 (457) – (105)2 r= 11450– 11445 . 12175 – 11881 11425 – 11025 r= 5 . = 5 . = 5 . = 0.014 294 400 117600 342.928 1 2 3 4 5 6 7 8 9 10 11 12 13 14 15 16 17 18 19 20 21 22 23 24 25 Σ I2 4 4 3 5 4 4 4 5 4 5 4 5 3 5 4 5 5 4 5 5 3 5 5 5 4 109 I6 4 5 5 4 4 4 4 4 3 5 4 4 4 5 3 3 4 5 5 4 4 5 4 4 5 105 I2 2 16 16 9 25 16 16 16 25 16 25 16 25 9 25 16 25 25 16 25 25 9 25 25 25 16 487 I6 2 16 25 25 16 16 16 16 16 9 25 16 16 16 25 15 9 16 25 25 16 16 25 16 16 25 457 I2x I6 16 20 15 20 16 16 16 20 12 25 16 20 12 25 12 15 20 20 25 20 12 25 20 20 20 458 Correlación baja I2-I6 I6-I2
- 24. Intervalos de correlación Valoración 0.20- 0.40 0.41- 0.60 0.61- 0.80 0.81- 0.99 Correlación baja Correlación media Correlación alta Correlación altísima
- 25. Aplicando el Coeficiente de Correlación de Pearson: n= numero de ítems: 25 = Σ I2 = 109 = Σ I6 = 108 = Σ I2 2 = 487 = Σ I6 2 = 476 = Σ I2 x I6 = 479 Reemplazando: r= 25 x 479– 109 x 108 . 25 (487) – (109)2 25 (476) – (108)2 r= 11975– 11772 . 12175 – 11881 11900 – 11664 r= 203 . = 203 . = 203 . = 0.771 294 236 69384 263.408 1 2 3 4 5 6 7 8 9 10 11 12 13 14 15 16 17 18 19 20 21 22 23 24 25 Σ I2 4 4 3 5 4 4 4 5 4 5 4 5 3 5 4 5 5 4 5 5 3 5 5 5 4 109 I7 4 5 4 5 4 4 4 5 4 5 4 4 3 5 4 5 4 4 5 5 3 4 5 5 4 108 I2 2 16 16 9 25 16 16 16 25 16 25 16 25 9 25 16 25 25 16 25 25 9 25 25 25 16 487 I7 2 16 25 16 25 16 16 16 25 16 25 16 16 9 25 16 25 16 16 25 25 9 16 25 25 16 476 I2x I7 16 20 12 25 16 16 16 25 16 25 16 20 9 25 16 25 20 16 25 25 9 20 25 25 16 479 Correlación alta I2-I7 I7-I2
- 26. Intervalos de correlación Valoración 0.20- 0.40 0.41- 0.60 0.61- 0.80 0.81- 0.99 Correlación baja Correlación media Correlación alta Correlación altísima
- 27. Aplicando el Coeficiente de Correlación de Pearson: n= numero de ítems: 25 = Σ I2 = 109 = Σ I8 = 114 = Σ I2 2 = 487 = Σ I8 2 = 528 = Σ I2 x I8 = 504 Reemplazando: r= 25 x 504– 109 x 114 . 25 (487) – (109)2 25 (528) – (114)2 r= 12600– 12426 . 12175 – 11881 13200 – 12996 r= 174 . = 174 . = 174 . = 0.710 294 204 59976 244.900 1 2 3 4 5 6 7 8 9 10 11 12 13 14 15 16 17 18 19 20 21 22 23 24 25 Σ I2 4 4 3 5 4 4 4 5 4 5 4 5 3 5 4 5 5 4 5 5 3 5 5 5 4 109 I8 5 4 4 5 4 4 4 5 4 5 4 5 5 5 4 5 5 4 5 5 3 5 5 5 5 114 I2 2 16 16 9 25 16 16 16 25 16 25 16 25 9 25 16 25 25 16 25 25 9 25 25 25 16 487 I8 2 25 16 16 25 16 16 16 25 16 25 16 25 25 25 16 25 25 16 25 25 9 25 25 25 25 528 I2x I8 20 16 12 25 16 16 16 25 16 25 16 25 15 25 16 25 25 16 25 25 9 25 25 25 20 504 Correlación alta I2-I8 I8-I2
- 28. Intervalos de correlación Valoración 0.20- 0.40 0.41- 0.60 0.61- 0.80 0.81- 0.99 Correlación baja Correlación media Correlación alta Correlación altísima
- 29. Aplicando el Coeficiente de Correlación de Pearson: n= numero de ítems: 25 = Σ I2 = 109 = Σ I8 = 113 = Σ I2 2 = 487 = Σ I8 2 = 514 = Σ I2 x I8 = 498 Reemplazando: r= 25 x 498– 109 x 113 . 25 (487) – (109)2 25 (514) – (113)2 r= 12450– 12317 . 12175 – 11881 12850 – 12769 r= 133 . = 133 . = 133 . = 0.862 294 81 23814 154.318 1 2 3 4 5 6 7 8 9 10 11 12 13 14 15 16 17 18 19 20 21 22 23 24 25 Σ I2 4 4 3 5 4 4 4 5 4 5 4 5 3 5 4 5 5 4 5 5 3 5 5 5 4 109 I9 5 5 4 5 4 4 4 4 4 5 4 5 5 5 4 5 5 4 5 5 3 4 5 5 5 113 I2 2 16 16 9 25 16 16 16 25 16 25 16 25 9 25 16 25 25 16 25 25 9 25 25 25 16 487 I9 2 25 25 16 25 16 16 16 16 16 25 16 25 25 25 16 25 25 16 25 25 9 16 25 25 20 514 I2x I9 20 20 12 25 16 16 16 20 16 25 16 25 15 25 16 25 25 16 25 25 9 20 25 25 20 498 Correlación altísima I2-I9 I9-I2
- 30. Intervalos de correlación Valoración 0.20- 0.40 0.41- 0.60 0.61- 0.80 0.81- 0.99 Correlación baja Correlación media Correlación alta Correlación altísima
- 31. Aplicando el Coeficiente de Correlación de Pearson: n= numero de ítems: 25 = Σ I2 = 109 = Σ I4 = 112 = Σ I2 2 = 483 = Σ I4 2 = 506 = Σ I2 x I4 = 490 Reemplazando: r= 25 x 490– 109 x 112 . 25 (483) – (109)2 25 (506) – (112)2 r= 12250– 12208 . 12075 – 11881 11650 – 12544 r= 42 . = 42 . = 42 . = 0.292 194 106 20564 143.402 1 2 3 4 5 6 7 8 9 10 11 12 13 14 15 16 17 18 19 20 21 22 23 24 25 Σ I3 4 5 4 4 5 5 4 5 4 4 4 5 4 5 4 4 5 5 5 4 4 5 4 4 3 109 I4 5 4 4 5 4 4 4 5 4 5 4 5 5 5 4 4 5 4 5 5 3 5 5 5 4 112 I3 2 16 25 16 16 25 25 16 25 16 16 16 25 16 25 16 16 25 25 25 16 16 25 16 16 9 483 I4 2 25 16 16 25 16 16 16 25 16 25 16 25 25 25 16 16 25 16 25 20 15 25 20 25 16 506 I3x I4 20 20 16 20 20 20 16 25 16 20 16 25 20 25 16 16 25 20 25 20 12 25 20 20 12 490 Correlación baja I3-I4 I4-I3
- 32. Intervalos de correlación Valoración 0.20- 0.40 0.41- 0.60 0.61- 0.80 0.81- 0.99 Correlación baja Correlación media Correlación alta Correlación altísima
- 33. Aplicando el Coeficiente de Correlación de Pearson: n= numero de ítems: 25 = Σ I3 = 109 = Σ I5 = 113 = Σ I3 2 = 483 = Σ I5 2 = 519 = Σ I3 x I5 = 497 Reemplazando: r= 25 x 497– 109 x 113 . 25 (483) – (109)2 25 (519) – (113)2 r= 12425– 12317 . 12075 – 11881 12975 – 12769 r= 108 . = 108 . = 108 . = 0.540 194 206 39964 199.910 1 2 3 4 5 6 7 8 9 10 11 12 13 14 15 16 17 18 19 20 21 22 23 24 25 Σ I3 4 5 4 4 5 5 4 5 4 4 4 5 4 5 4 4 5 5 5 4 4 5 4 4 3 109 I5 5 4 4 5 4 4 4 5 4 5 4 5 5 5 4 5 5 4 5 5 3 4 5 5 5 113 I3 2 16 25 16 16 25 25 16 25 16 16 16 25 16 25 16 16 25 25 25 16 16 25 16 16 9 483 I5 2 25 16 16 25 16 16 16 25 16 25 16 25 25 25 16 25 25 16 25 25 9 16 25 25 25 519 I3x I5 20 20 16 25 20 20 16 25 16 20 16 25 20 25 16 20 25 20 25 20 12 20 20 20 15 497 Correlación media I3-I5 I5-I3
- 34. Intervalos de correlación Valoración 0.20- 0.40 0.41- 0.60 0.61- 0.80 0.81- 0.99 Correlación baja Correlación media Correlación alta Correlación altísima
- 35. Aplicando el Coeficiente de Correlación de Pearson: n= numero de ítems: 25 = Σ I3 = 109 = Σ I6 = 105 = Σ I3 2 = 481 = Σ I6 2 = 457 = Σ I3 x I6 = 460 Reemplazando: r= 25 x 460– 109 x 105 . 25 (483) – (109)2 25 (457) – (105)2 r= 11500– 11445 . 12075 – 11881 11425 – 11025 r= 55 . = 55 . = 55 . = 0.197 194 400 77600 278.568 1 2 3 4 5 6 7 8 9 10 11 12 13 14 15 16 17 18 19 20 21 22 23 24 25 Σ I3 4 5 4 4 5 5 4 5 4 4 4 5 4 5 4 4 5 5 5 4 4 5 4 4 3 109 I6 4 5 5 4 4 4 4 4 3 5 4 4 4 5 3 3 4 5 5 4 4 5 4 4 5 105 I3 2 16 25 16 16 25 25 16 25 16 16 16 25 16 25 16 16 25 25 25 16 16 25 16 16 9 483 I6 2 16 25 25 16 16 16 16 16 9 25 16 16 16 25 15 9 16 25 25 16 16 25 16 16 25 457 I3x I6 16 25 20 16 20 20 16 20 12 20 16 20 16 25 12 12 20 25 25 16 16 25 16 16 15 460 Correlación baja I3-I6 I6-I3
- 36. Intervalos de correlación Valoración 0.20- 0.40 0.41- 0.60 0.61- 0.80 0.81- 0.99 Correlación baja Correlación media Correlación alta Correlación altísima
- 37. Aplicando el Coeficiente de Correlación de Pearson: n= numero de ítems: 25 = Σ I3 = 109 = Σ I7 = 108 = Σ I3 2 = 483 = Σ I7 2 = 476 = Σ I3 x I7 = 472 Reemplazando: r= 25 x 472– 109 x 108 . 25 (483) – (109)2 25 (476) – (108)2 r= 11800– 11772 . 12075 – 11881 11900 – 11448 r= 28 . = 28 . = 28 . = 0.096 194 452 87688 296.122 1 2 3 4 5 6 7 8 9 10 11 12 13 14 15 16 17 18 19 20 21 22 23 24 25 Σ I3 4 5 4 4 5 5 4 5 4 4 4 5 4 5 4 4 5 5 5 4 4 5 4 4 3 109 I7 4 5 4 5 4 4 4 5 4 5 4 4 3 5 4 5 4 4 5 5 3 4 5 5 4 108 I3 2 16 25 16 16 25 25 16 25 16 16 16 25 16 25 16 16 25 25 25 16 16 25 16 16 9 483 I7 2 16 25 16 25 16 16 16 25 16 25 16 16 9 25 16 25 16 16 25 25 9 16 25 25 16 476 I3x I6 16 25 16 20 20 20 16 25 16 20 16 20 12 25 16 20 20 20 25 20 12 20 20 20 12 472 Correlación baja I3-I7 I7-I3
- 38. Intervalos de correlación Valoración 0.20- 0.40 0.41- 0.60 0.61- 0.80 0.81- 0.99 Correlación baja Correlación media Correlación alta Correlación altísima
- 39. Aplicando el Coeficiente de Correlación de Pearson: n= numero de ítems: 25 = Σ I3 = 109 = Σ I8 = 114 = Σ I3 2 = 483 = Σ I8 2 = 528 = Σ I3 x I8 = 500 Reemplazando: r= 25 x 500– 109 x 114 . 25 (483) – (109)2 25 (528) – (114)2 r= 12500– 12426 . 12075 – 11881 13200 – 12996 r= 74 . = 74 . = 74 . = 0.372 194 201 39576 198.937 1 2 3 4 5 6 7 8 9 10 11 12 13 14 15 16 17 18 19 20 21 22 23 24 25 Σ I3 4 5 4 4 5 5 4 5 4 4 4 5 4 5 4 4 5 5 5 4 4 5 4 4 3 109 I8 5 4 4 5 4 4 4 5 4 5 4 5 5 5 4 5 5 4 5 5 3 5 5 5 5 114 I3 2 16 25 16 16 25 25 16 25 16 16 16 25 16 25 16 16 25 25 25 16 16 25 16 16 9 483 I8 2 25 16 16 25 16 16 16 25 16 25 16 25 25 25 16 25 25 16 25 25 9 25 25 25 25 528 I3x I8 20 20 16 20 20 20 16 25 16 20 16 25 20 25 16 20 25 20 25 20 12 25 20 20 15 500 Correlación baja I3-I8 I8-I3
- 40. Intervalos de correlación Valoración 0.20- 0.40 0.41- 0.60 0.61- 0.80 0.81- 0.99 Correlación baja Correlación media Correlación alta Correlación altísima
- 41. Aplicando el Coeficiente de Correlación de Pearson: n= numero de ítems: 25 = Σ I3 = 109 = Σ I9 = 113 = Σ I3 2 = 483 = Σ I9 2 = 514 = Σ I3 x I9 = 496 Reemplazando: r= 25 x 496– 109 x 113 . 25 (471) – (106)2 25 (514) – (113)2 r= 12400– 12317 . 12075 – 11881 12850 – 12769 r= 83 . = 83 . = 83 . = 0.662 194 81 15714 125.355 1 2 3 4 5 6 7 8 9 10 11 12 13 14 15 16 17 18 19 20 21 22 23 24 25 Σ I3 4 5 4 4 5 5 4 5 4 4 4 5 4 5 4 4 5 5 5 4 4 5 4 4 3 109 I9 5 5 4 5 4 4 4 4 4 5 4 5 5 5 4 5 5 4 5 5 3 4 5 5 5 113 I3 2 16 25 16 16 25 25 16 25 16 16 16 25 16 25 16 16 25 25 25 16 16 25 16 16 9 483 I9 2 25 25 16 25 16 16 16 16 16 25 16 25 25 25 16 25 25 16 25 25 9 16 25 25 20 514 I3x I9 20 25 16 20 20 20 16 20 16 20 16 25 20 25 16 20 25 20 25 20 12 20 20 20 15 496 Correlación alta I3-I9 I9-I3
- 42. Intervalos de correlación Valoración 0.20- 0.40 0.41- 0.60 0.61- 0.80 0.81- 0.99 Correlación baja Correlación media Correlación alta Correlación altísima
- 43. Aplicando el Coeficiente de Correlación de Pearson: n= numero de ítems: 25 = Σ I4 = 112 = Σ I5 = 113 = Σ I4 2 = 506 = Σ I5 2 = 519 = Σ I4 x I5 = 512 Reemplazando: r= 25 x 512– 112 x 113 . 25 (506) – (112)2 25 (519) – (113)2 r= 12800– 12656 . 11650 – 12544 12975 – 12769 r= 144 . = . 144 . = 144 . = 0.974 106 206 21836 147.770 1 2 3 4 5 6 7 8 9 10 11 12 13 14 15 16 17 18 19 20 21 22 23 24 25 Σ I4 5 4 4 5 4 4 4 5 4 5 4 5 5 5 4 4 5 4 5 5 3 5 5 5 4 112 I5 5 4 4 5 4 4 4 5 4 5 4 5 5 5 4 5 5 4 5 5 3 4 5 5 5 113 I4 2 25 16 16 25 16 16 16 25 16 25 16 25 25 25 16 16 25 16 25 20 15 25 20 25 16 506 I5 2 25 16 16 25 16 16 16 25 16 25 16 25 25 25 16 25 25 16 25 25 9 16 25 25 25 519 I4x I5 25 16 16 25 16 16 16 25 16 25 16 25 25 25 16 20 25 16 25 25 9 20 25 25 20 512 Correlación altísima I4-I5 I5-I4
- 44. Intervalos de correlación Valoración 0.20- 0.40 0.41- 0.60 0.61- 0.80 0.81- 0.99 Correlación baja Correlación media Correlación alta Correlación altísima
- 45. Aplicando el Coeficiente de Correlación de Pearson: n= numero de ítems: 25 = Σ I4 = 112 = Σ I6 = 105 = Σ I4 2 = 506 = Σ I6 2 = 457 = Σ I4 x I6 = 473 Reemplazando: r= 25 x 473– 112 x 105 . 25 (506) – (112)2 25 (457) – (105)2 r= 11825- 11760 . 11650 – 12544 11425 – 11025 r= 65 . = . 65 . = 65 . = 0.316 106 400 42400 205.913 1 2 3 4 5 6 7 8 9 10 11 12 13 14 15 16 17 18 19 20 21 22 23 24 25 Σ I4 5 4 4 5 4 4 4 5 4 5 4 5 5 5 4 4 5 4 5 5 3 5 5 5 4 112 I6 4 5 5 4 4 4 4 4 3 5 4 4 4 5 3 3 4 5 5 4 4 5 4 4 5 105 I4 2 25 16 16 25 16 16 16 25 16 25 16 25 25 25 16 16 25 16 25 20 15 25 20 25 16 506 I6 2 16 25 25 16 16 16 16 16 9 25 16 16 16 25 15 9 16 25 25 16 16 25 16 16 25 457 I4x I6 20 20 20 20 16 16 16 20 12 25 16 20 20 25 12 12 20 20 25 20 12 25 20 20 20 472 Correlación baja I4-I6 I6-I4
- 46. Intervalos de correlación Valoración 0.20- 0.40 0.41- 0.60 0.61- 0.80 0.81- 0.99 Correlación baja Correlación media Correlación alta Correlación altísima
- 47. Aplicando el Coeficiente de Correlación de Pearson: n= numero de ítems: 25 = Σ I4 = 112 = Σ I6 = 108 = Σ I4 2 = 506 = Σ I6 2 = 476 = Σ I4 x I6 = 488 Reemplazando: r= 25 x 488– 112 x 108 . 25 (506) – (112)2 25 (476) – (108)2 r= 12200- 12096 . 11650 – 12544 11900 – 11664 r= 104 . = . 104 . = 104. = 0.658 106 236 25016 158.164 1 2 3 4 5 6 7 8 9 10 11 12 13 14 15 16 17 18 19 20 21 22 23 24 25 Σ I4 5 4 4 5 4 4 4 5 4 5 4 5 5 5 4 4 5 4 5 5 3 5 5 5 4 112 I7 4 5 4 5 4 4 4 5 4 5 4 4 3 5 4 5 4 4 5 5 3 4 5 5 4 108 I4 2 25 16 16 25 16 16 16 25 16 25 16 25 25 25 16 16 25 16 25 20 15 25 20 25 16 506 I7 2 16 25 16 25 16 16 16 25 16 25 16 16 9 25 16 25 16 16 25 25 9 16 25 25 16 476 I4x I7 20 20 16 25 16 16 16 25 16 25 16 20 15 25 16 20 20 16 25 25 9 20 25 25 16 488 Correlación alta I4-I7 I7-I4
- 48. Intervalos de correlación Valoración 0.20- 0.40 0.41- 0.60 0.61- 0.80 0.81- 0.99 Correlación baja Correlación media Correlación alta Correlación altísima
- 49. Aplicando el Coeficiente de Correlación de Pearson: n= numero de ítems: 25 = Σ I4 = 112 = Σ I8 = 114 = Σ I4 2 = 506 = Σ I8 2 = 528 = Σ I4 x I8 = 518 Reemplazando: r= 25 x 516– 112 x 114 . 25 (506) – (112)2 25 (528) – (114)2 r= 12900- 12768 . 11650 – 12544 13200 – 12996 r= 132 . = . 132 . = 132 . = 0.898 106 204 21624 147.051 1 2 3 4 5 6 7 8 9 10 11 12 13 14 15 16 17 18 19 20 21 22 23 24 25 Σ I4 5 4 4 5 4 4 4 5 4 5 4 5 5 5 4 4 5 4 5 5 3 5 5 5 4 112 I8 5 4 4 5 4 4 4 5 4 5 4 5 5 5 4 5 5 4 5 5 3 5 5 5 5 114 I4 2 25 16 16 25 16 16 16 25 16 25 16 25 25 25 16 16 25 16 25 20 15 25 20 25 16 506 I8 2 25 16 16 25 16 16 16 25 16 25 16 25 25 25 16 25 25 16 25 25 9 25 25 25 25 528 I4x I8 25 16 16 25 16 16 16 25 16 25 16 25 25 25 16 20 25 16 25 25 9 25 25 25 20 516 Correlación altísima I4-I8 I8-I4
- 50. Intervalos de correlación Valoración 0.20- 0.40 0.41- 0.60 0.61- 0.80 0.81- 0.99 Correlación baja Correlación media Correlación alta Correlación altísima
- 51. Aplicando el Coeficiente de Correlación de Pearson: n= numero de ítems: 25 = Σ I4 = 112 = Σ I8 = 113 = Σ I4 2 = 506 = Σ I8 2 = 514 = Σ I4 x I8 = 512 Reemplazando: r= 25 x 509– 112 x 113 . 25 (506) – (112)2 25 (514) – (113)2 r= 12725- 12656 . 11650 – 12544 12850 – 12769 r= 69 . = . 69 . = 69 . = 0.747 106 81 8586 92.661 1 2 3 4 5 6 7 8 9 10 11 12 13 14 15 16 17 18 19 20 21 22 23 24 25 Σ I4 5 4 4 5 4 4 4 5 4 5 4 5 5 5 4 4 5 4 5 5 3 5 5 5 4 112 I9 5 5 4 5 4 4 4 4 4 5 4 5 5 5 4 5 5 4 5 5 3 4 5 5 5 113 I4 2 25 16 16 25 16 16 16 25 16 25 16 25 25 25 16 16 25 16 25 20 15 25 20 25 16 506 I9 2 25 25 16 25 16 16 16 16 16 25 16 25 25 25 16 25 25 16 25 25 9 16 25 25 20 514 I4x I9 25 20 16 25 16 16 16 20 16 25 16 25 25 25 16 20 25 16 25 25 9 20 25 25 20 509 Correlación alta I4-I9 I9-I4
- 52. Intervalos de correlación Valoración 0.20- 0.40 0.41- 0.60 0.61- 0.80 0.81- 0.99 Correlación baja Correlación media Correlación alta Correlación altísima
- 53. Aplicando el Coeficiente de Correlación de Pearson: n= numero de ítems: 25 = Σ I5 = 113 = Σ I6 = 105 = Σ I5 2 = 519 = Σ I6 2 = 457 = Σ I5 x I6 = 475 Reemplazando: r= 25 x 475– 113 x 105 . 25 (519) – (113)2 25 (457) – (105)2 r= 11875- 11865 . 12975 – 12769 12850 – 12769 r= 10 . = . 10 . = 10 . = 0.077 206 81 16686 129.174 1 2 3 4 5 6 7 8 9 10 11 12 13 14 15 16 17 18 19 20 21 22 23 24 25 Σ I5 5 4 4 5 4 4 4 5 4 5 4 5 5 5 4 5 5 4 5 5 3 4 5 5 5 113 I6 4 5 5 4 4 4 4 4 3 5 4 4 4 5 3 3 4 5 5 4 4 5 4 4 5 105 I5 2 25 16 16 25 16 16 16 25 16 25 16 25 25 25 16 25 25 16 25 25 9 16 25 25 25 519 I6 2 16 25 25 16 16 16 16 16 9 25 16 16 16 25 15 9 16 25 25 16 16 25 16 16 25 457 I5x I6 20 20 20 20 16 16 16 20 12 25 16 20 20 25 12 15 20 20 25 20 12 20 20 20 25 475 Correlación baja I5-I6 I6-I5
- 54. Intervalos de correlación Valoración 0.20- 0.40 0.41- 0.60 0.61- 0.80 0.81- 0.99 Correlación baja Correlación media Correlación alta Correlación altísima
- 55. Aplicando el Coeficiente de Correlación de Pearson: n= numero de ítems: 25 = Σ I5 = 113 = Σ I6 = 108 = Σ I5 2 = 519 = Σ I6 2 = 476 = Σ I5 x I6 = 493 Reemplazando: r= 25 x 493– 113 x 108 . 25 (519) – (113)2 25 (476) – (108)2 r= 12325- 12204 . 12975 – 12769 11900 – 11664 r= 121 . = . 121 . = 121 . = 0.549 206 236 48616 220.490 1 2 3 4 5 6 7 8 9 10 11 12 13 14 15 16 17 18 19 20 21 22 23 24 25 Σ I5 5 4 4 5 4 4 4 5 4 5 4 5 5 5 4 5 5 4 5 5 3 4 5 5 5 113 I7 4 5 4 5 4 4 4 5 4 5 4 4 3 5 4 5 4 4 5 5 3 4 5 5 4 108 I5 2 25 16 16 25 16 16 16 25 16 25 16 25 25 25 16 25 25 16 25 25 9 16 25 25 25 519 I7 2 16 25 16 25 16 16 16 25 16 25 16 16 9 25 16 25 16 16 25 25 9 16 25 25 16 476 I5x I7 20 20 16 25 16 16 16 25 16 25 16 20 15 25 16 25 20 16 25 25 9 16 25 25 20 493 Correlación media I5-I7 I7-I5
- 56. Intervalos de correlación Valoración 0.20- 0.40 0.41- 0.60 0.61- 0.80 0.81- 0.99 Correlación baja Correlación media Correlación alta Correlación altísima
- 57. Aplicando el Coeficiente de Correlación de Pearson: n= numero de ítems: 25 = Σ I5 = 113 = Σ I6 = 114 = Σ I5 2 = 519 = Σ I6 2 = 528 = Σ I5 x I6 = 522 Reemplazando: r= 25 x 522– 113 x 114 . 25 (519) – (113)2 25 (528) – (114)2 r= 13050- 12882 . 12975 – 12769 13200 – 12996 r= 168 . = . 168 . = 168 . = 0.819 206 204 42024 204.998 1 2 3 4 5 6 7 8 9 10 11 12 13 14 15 16 17 18 19 20 21 22 23 24 25 Σ I5 5 4 4 5 4 4 4 5 4 5 4 5 5 5 4 5 5 4 5 5 3 4 5 5 5 113 I8 5 4 4 5 4 4 4 5 4 5 4 5 5 5 4 5 5 4 5 5 3 5 5 5 5 114 I5 2 25 16 16 25 16 16 16 25 16 25 16 25 25 25 16 25 25 16 25 25 9 16 25 25 25 519 I8 2 25 16 16 25 16 16 16 25 16 25 16 25 25 25 16 25 25 16 25 25 9 25 25 25 25 528 I5x I8 25 16 16 25 16 16 16 25 16 25 16 25 25 25 16 25 25 16 25 25 9 20 25 25 25 523 Correlación altísima I5-I8 I8-I5
- 58. Intervalos de correlación Valoración 0.20- 0.40 0.41- 0.60 0.61- 0.80 0.81- 0.99 Correlación baja Correlación media Correlación alta Correlación altísima
- 59. Aplicando el Coeficiente de Correlación de Pearson: n= numero de ítems: 25 = Σ I5 = 113 = Σ I6 = 113 = Σ I5 2 = 519 = Σ I6 2 = 514 = Σ I5 x I6 = 518 Reemplazando: r= 25 x 518– 113 x 113 . 25 (519) – (113)2 25 (514) – (113)2 r= 12950- 12769 . 12975 – 12769 13200 – 12996 r= 181 . = . 181 . = 181 . = 0.882 206 204 42024 204.998 1 2 3 4 5 6 7 8 9 10 11 12 13 14 15 16 17 18 19 20 21 22 23 24 25 Σ I5 5 4 4 5 4 4 4 5 4 5 4 5 5 5 4 5 5 4 5 5 3 4 5 5 5 113 I9 5 5 4 5 4 4 4 4 4 5 4 5 5 5 4 5 5 4 5 5 3 4 5 5 5 113 I5 2 25 16 16 25 16 16 16 25 16 25 16 25 25 25 16 25 25 16 25 25 9 16 25 25 25 519 I9 2 25 25 16 25 16 16 16 16 16 25 16 25 25 25 16 25 25 16 25 25 9 16 25 25 20 514 I5x I8 25 20 16 25 16 16 16 20 16 25 16 25 25 25 16 25 25 16 25 25 9 16 25 25 25 518 Correlación altísima I5-I9 I9-I5
- 60. Intervalos de correlación Valoración 0.20- 0.40 0.41- 0.60 0.61- 0.80 0.81- 0.99 Correlación baja Correlación media Correlación alta Correlación altísima
- 61. Aplicando el Coeficiente de Correlación de Pearson: n= numero de ítems: 25 = Σ I6 = 105 = Σ I7 = 108 = Σ I6 2 = 457 = Σ I7 2 = 476 = Σ I6 x I7 = 455 Reemplazando: r= 25 x 455– 105 x 108 25 (457) – (105)2 25 (476) – (108)2 r= 11375- 11340 . 11425 – 11025 11900 – 11664 r= 35 . = . 35 . = 35 . = 0.114 400 236 94400 307.246 1 2 3 4 5 6 7 8 9 10 11 12 13 14 15 16 17 18 19 20 21 22 23 24 25 Σ I6 4 5 5 4 4 4 4 4 3 5 4 4 4 5 3 3 4 5 5 4 4 5 4 4 5 105 I7 4 5 4 5 4 4 4 5 4 5 4 4 3 5 4 5 4 4 5 5 3 4 5 5 4 108 I6 2 16 25 25 16 16 16 16 16 9 25 16 16 16 25 15 9 16 25 25 16 16 25 16 16 25 457 I7 2 16 25 16 25 16 16 16 25 16 25 16 16 9 25 16 25 16 16 25 25 9 16 25 25 16 476 I6x I7 16 25 20 20 16 16 16 20 12 25 16 16 12 25 12 15 16 20 25 20 12 20 20 20 20 455 Correlación baja I6-I7 I7-I6
- 62. Intervalos de correlación Valoración 0.20- 0.40 0.41- 0.60 0.61- 0.80 0.81- 0.99 Correlación baja Correlación media Correlación alta Correlación altísima
- 63. Aplicando el Coeficiente de Correlación de Pearson: n= numero de ítems: 25 = Σ I6 = 105 = Σ I7 = 114 = Σ I6 2 = 457 = Σ I7 2 = 528 = Σ I6 x I7 = 480 Reemplazando: r= 25 x 480– 105 x 114 25 (457) – (105)2 25 (528) – (114)2 r= 12000- 11970 . 11425 – 11025 13200 – 12996 r= 30 . = . 30 . = 35 . = 0.123 400 204 81600 285.657 1 2 3 4 5 6 7 8 9 10 11 12 13 14 15 16 17 18 19 20 21 22 23 24 25 Σ I6 4 5 5 4 4 4 4 4 3 5 4 4 4 5 3 3 4 5 5 4 4 5 4 4 5 105 I8 5 4 4 5 4 4 4 5 4 5 4 5 5 5 4 5 5 4 5 5 3 5 5 5 5 114 I6 2 16 25 25 16 16 16 16 16 9 25 16 16 16 25 15 9 16 25 25 16 16 25 16 16 25 457 I8 2 25 16 16 25 16 16 16 25 16 25 16 25 25 25 16 25 25 16 25 25 9 25 25 25 25 528 I6x I8 20 20 20 20 16 16 16 20 12 25 16 20 20 25 12 15 20 20 25 20 12 25 20 20 25 480 Correlación baja I6-I8 I8-I6
- 64. Intervalos de correlación Valoración 0.20- 0.40 0.41- 0.60 0.61- 0.80 0.81- 0.99 Correlación baja Correlación media Correlación alta Correlación altísima
- 65. Aplicando el Coeficiente de Correlación de Pearson: n= numero de ítems: 25 = Σ I6 = 105 = Σ I7 = 113 = Σ I6 2 = 457 = Σ I7 2 = 514 = Σ I6 x I7 = 476 Reemplazando: r= 25 x 476– 105 x 113 25 (457) – (105)2 25 (514) – (113)2 r= 11900- 11865 . 11425 – 11025 12850 – 12769 r= 35 . = . 35 . = 35 . = 0.194 400 81 32400 180 1 2 3 4 5 6 7 8 9 10 11 12 13 14 15 16 17 18 19 20 21 22 23 24 25 Σ I6 4 5 5 4 4 4 4 4 3 5 4 4 4 5 3 3 4 5 5 4 4 5 4 4 5 105 I9 5 5 4 5 4 4 4 4 4 5 4 5 5 5 4 5 5 4 5 5 3 4 5 5 5 113 I6 2 16 25 25 16 16 16 16 16 9 25 16 16 16 25 15 9 16 25 25 16 16 25 16 16 25 457 I9 2 25 25 16 25 16 16 16 16 16 25 16 25 25 25 16 25 25 16 25 25 9 16 25 25 20 514 I6x I9 20 25 20 20 16 16 16 16 12 25 16 20 20 25 12 15 20 20 25 20 12 20 20 20 25 476 Correlación baja I6-I9 I9-I6
- 66. Intervalos de correlación Valoración 0.20- 0.40 0.41- 0.60 0.61- 0.80 0.81- 0.99 Correlación baja Correlación media Correlación alta Correlación altísima
- 67. Aplicando el Coeficiente de Correlación de Pearson: n= numero de ítems: 25 = Σ I7 = 108 = Σ I8 = 114 = Σ I7 2 = 476 = Σ I8 2 = 528 = Σ I7 x I8 = 497 Reemplazando: r= 25 x 497– 108 x 114 25 (476) – (108)2 25 (528) – (114)2 r= 12425- 12312 . 11900 – 11664 13200 – 12996 r= 113 . = . 113. = 113 . = 0.515 236 204 48144 219.417 1 2 3 4 5 6 7 8 9 10 11 12 13 14 15 16 17 18 19 20 21 22 23 24 25 Σ I7 4 5 4 5 4 4 4 5 4 5 4 4 3 5 4 5 4 4 5 5 3 4 5 5 4 108 I8 5 4 4 5 4 4 4 5 4 5 4 5 5 5 4 5 5 4 5 5 3 5 5 5 5 114 I7 2 16 25 16 25 16 16 16 25 16 25 16 16 9 25 16 25 16 16 25 25 9 16 25 25 16 476 I8 2 25 16 16 25 16 16 16 25 16 25 16 25 25 25 16 25 25 16 25 25 9 25 25 25 25 528 I7x I8 20 20 16 25 16 16 16 25 16 25 16 20 15 25 16 25 20 16 25 25 9 20 25 25 20 497 Correlación media I7-I8 I8-I7
- 68. Intervalos de correlación Valoración 0.20- 0.40 0.41- 0.60 0.61- 0.80 0.81- 0.99 Correlación baja Correlación media Correlación alta Correlación altísima
- 69. Aplicando el Coeficiente de Correlación de Pearson: n= numero de ítems: 25 = Σ I7 = 108 = Σ I8 = 113 = Σ I7 2 = 476 = Σ I8 2 = 514 = Σ I7 x I8 = 493 Reemplazando: r= 25 x 493– 108 x 113 25 (476) – (108)2 25 (514) – (113)2 r= 12325- 12204 . 11900 – 11664 12850 – 12769 r= 121 . = . 121. = 121 . = 0.875 236 81 19116 138.261 1 2 3 4 5 6 7 8 9 10 11 12 13 14 15 16 17 18 19 20 21 22 23 24 25 Σ I7 4 5 4 5 4 4 4 5 4 5 4 4 3 5 4 5 4 4 5 5 3 4 5 5 4 108 I9 5 5 4 5 4 4 4 4 4 5 4 5 5 5 4 5 5 4 5 5 3 4 5 5 5 113 I7 2 16 25 16 25 16 16 16 25 16 25 16 16 9 25 16 25 16 16 25 25 9 16 25 25 16 476 I9 2 25 25 16 25 16 16 16 16 16 25 16 25 25 25 16 25 25 16 25 25 9 16 25 25 20 514 I7x I9 20 25 16 25 16 16 16 20 16 25 16 20 15 25 16 25 20 16 25 25 9 16 25 25 20 493 Correlación altísima I7-I9 I9-I7
- 70. Intervalos de correlación Valoración 0.20- 0.40 0.41- 0.60 0.61- 0.80 0.81- 0.99 Correlación baja Correlación media Correlación alta Correlación altísima
- 71. Aplicando el Coeficiente de Correlación de Pearson: n= numero de ítems: 25 = Σ I8 = 114 = Σ I9 = 113 = Σ I8 2 = 528 = Σ I9 2 = 514 = Σ I8 x I9 = 520 Reemplazando: r= 25 x 520– 114 x 113 25 (528) – (114)2 25 (514) – (113)2 r= 13000- 12882 . 13200 – 12996 12850 – 12769 r= 118 . = . 118. = 118 . = 0.918 204 81 16524 128.546 1 2 3 4 5 6 7 8 9 10 11 12 13 14 15 16 17 18 19 20 21 22 23 24 25 Σ I8 5 4 4 5 4 4 4 5 4 5 4 5 5 5 4 5 5 4 5 5 3 5 5 5 5 114 I9 5 5 4 5 4 4 4 4 4 5 4 5 5 5 4 5 5 4 5 5 3 4 5 5 5 113 I8 2 25 16 16 25 16 16 16 25 16 25 16 25 25 25 16 25 25 16 25 25 9 25 25 25 25 528 I9 2 25 25 16 25 16 16 16 16 16 25 16 25 25 25 16 25 25 16 25 25 9 16 25 25 20 514 I8x I9 25 20 16 25 16 16 16 20 16 25 16 25 25 25 16 25 25 16 25 25 9 20 25 25 25 520 Correlación altísima I8-I9 I9-I8