Este documento presenta el manual básico de instrucciones y comandos del software Smart DFD 1.0, desarrollado para apoyar la enseñanza de la lógica de programación a través de diagramas de flujo. Describe la ventana principal del programa, incluyendo la barra de menús con sus diferentes opciones y los botones de la barra de herramientas. También explica cómo crear diagramas de flujo e insertar y editar diferentes tipos de bloques.
Framework for a set of e-Government Core IndicatorsDr Lendy Spires
Background Information and communication technology (ICT) and its applications offer many opportunities for economic and human development. Within the framework of the World Summit on the Information Society (WSIS), national governments, together with other stakeholders at national, regional and international levels are engaged in conceptualizing and deploying ICT and e-government applications in support of development. Inherent within these approaches is the issue of policy development and monitoring of ICT programmes.
The Geneva phase of WSIS established a set of targets for development of the information society. It included a target to: “Connect all local and central government departments and establish websites and e-mail addresses”. A recent publication by the Partnership (2011) suggested a set of e-government core indicators to measure this target. Many of the standards developed for those indicators have been adapted for this report. Box 1: The Partnership on Measuring ICT for Development Stemming from the mandate of the WSIS, the Partnership on Measuring ICT for Development is the collaborative initiative of a number of international organizations.
Its current members are: Eurostat, the International Telecommunication Union, the Organisation for Economic Co-operation and Development, the United Nations Conference on Trade and Development, the United Nations Department of Economic and Social Affairs, the UNESCO Institute for Statistics, the World Bank, and four United Nations Regional Commissions (Economic Commission for Africa, Economic Commission for Latin America and the Caribbean, Economic and Social Commission for Asia and the Pacific, and the Economic and Social Commission for Western Asia). Launched in 2004, the key goal of the Partnership is to develop internationally comparable, relevant and reliable ICT statistics for measurement of the information society.
Development and maintenance of a core list of ICT indicators is one of its activities, and the development of e-government indicators is undertaken specifically in this context (ITU, 2010). In 2005, the Partnership launched the first edition of Core ICT Indicators followed by the latest edition published in 2010 (Partnership 2005; 2010). Both publications focused on the feasibility and relevance of these ICT core indicators. The objective was to provide a reliable and accurate understanding of the indicators and the associated statistical standards. For more information on the Partnership, see: http://measuring-ict.unctad.org.
The United Nations Statistical Commission (UNSC), at its 2007 meeting, asked the Partnership on Measuring ICT for Development to extend the core list of ICT indicators to include indicators on ICT use in government (UNSC, 2007). The Partnership, through its Task Group on e-Govern-ment, has been actively engaged in the development of internationally comparable e-government indicators since 2006.
Harmonization of ICTs policies and programmes in East Africa Subregion and Pr...Dr Lendy Spires
Developing the sector of Information and Communication Technology (ICT) remains a crucial element in socio-economic development in general and in the process of regional economic integration in particular. In addition, it constitutes a strategic priority for States in the sub-region in the fight against poverty and in promoting education at all levels.
As a matter of fact, ICT contributes to economic growth by
(1) increasing productivity in all sectors;
(2) creating a conducive environment for market expansion beyond national borders and benefiting from economies of scale;
(3) reducing costs and facilitating easy access to services, particularly in the fields of administration, education, health and banking;
(4) facilitating access to research;
(5) developing ICT-related products and services;
(6) contributing to better governance, an essential ingredient for growth, through increased participation, accountability and transparency.
Embracing ICT gives broader possibilities of positive externalisation and encourages creativity, learning, and augments people’s aptitudes to resolve problems. However, its influence on employment, on new types of exports and on direct foreign investments depends on a number of factors: “It is the interaction between connectivity, access, security of the network, capacities and competencies, the market structures and the management of enterprises, as well as the regulatory and commercial framework that determine the aptitude of enterprises in a developing country to effectively and efficiently participate in the information economy and to compete in the global electronic markets”.
A number of ICT development initiatives have already been undertaken in Eastern Africa, particularly by the member States, the Regional Economic Communities (IGAD, EAC, COMESA), the African Union (AU), the Economic Commission for Africa (ECA), the International Communications Union (ICU) and the African Telecommunications Union (ATU), etc., in an effort to close the existing digital gap. These inter-state institutions encourage their members to complement the right of regional institutions by a component on “Harmonised Regulation of the ICT Sector”. In this regard, the countries of Eastern Africa have registered steady progress along the path towards economic integration and the development of a common market. In order to facilitate the harmonisation of their national sectortal policies, the Economic Commission for Africa carried out this Study with a view to examining the legal and regulatory regimens, as well as the national ICT institutional frameworks in each of the 13 member States and to compare the performance of the ICT sector vis-à-vis the best international practices
Los desafíos de calidad de software que nos trae la IA y los LLMsFederico Toledo
En esta charla, nos sumergiremos en los desafíos emergentes que la inteligencia artificial (IA) y los Large Language Models (LLMs) traen al mundo de la calidad del software y el testing. Exploraremos cómo la integración, uso o diseño de modelos de IA plantean nuevos retos, incluyendo la calidad de datos y detección de sesgos, sumando la complejidad de probar algo no determinístico. Revisaremos algunas propuestas que se están llevando adelante para ajustar nuestras tareas de testing al desarrollo de este tipo de sistemas, incluyendo enfoques de pruebas automatizadas y observabilidad.
Escaneo y eliminación de malware en el equiponicromante2000
El malware tiene muchas caras, y es que los programas maliciosos se reproducen en los ordenadores de diferentes formas. Ya se trate de virus, de programas espía o de troyanos, la presencia de software malicioso en los sistemas informáticos siempre debería evitarse. Aquí te muestro como trabaja un anti malware a la hora de analizar tu equipo
Si bien los hospitales conjuntan a profesionales de salud que atienden a la población, existe un equipo de organización, coordinación y administración que permite que los cuidados clínicos se otorguen de manera constante y sin obstáculos.
Mario García Baltazar, director del área de Tecnología (TI) del Hospital Victoria La Salle, relató la manera en la que el departamento que él lidera, apoyado en Cirrus y Estela, brinda servicio a los clientes internos de la institución e impulsa una experiencia positiva en el paciente.
Conoce el Hospital Victoria La Salle
Ubicado en Ciudad Victoria, Tamaulipas, México
Inició operaciones en el 2016
Forma parte del Consorcio Mexicanos de Hospitales
Hospital de segundo nivel
21 habitaciones para estancia
31 camas censables
13 camillas
2 quirófanos
+174 integrantes en su plantilla
+120 equipos médicos de alta tecnología
+900 pacientes atendidos
Servicios de +20 especialidades
Módulos utilizados de Cirrus
HIS
EHR
ERP
Estela - Business Intelligence
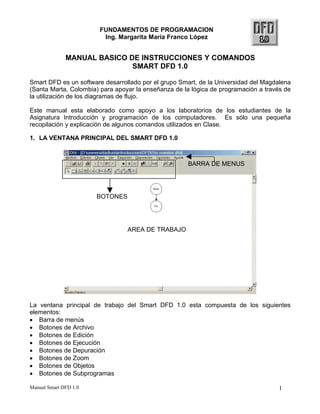
1. FUNDAMENTOS DE PROGRAMACION
Ing. Margarita María Franco López
MANUAL BASICO DE INSTRUCCIONES Y COMANDOS
SMART DFD 1.0
Smart DFD es un software desarrollado por el grupo Smart, de la Universidad del Magdalena
(Santa Marta, Colombia) para apoyar la enseñanza de la lógica de programación a través de
la utilización de los diagramas de flujo.
Este manual esta elaborado como apoyo a los laboratorios de los estudiantes de la
Asignatura Introducción y programación de los computadores. Es sólo una pequeña
recopilación y explicación de algunos comandos utilizados en Clase.
1. LA VENTANA PRINCIPAL DEL SMART DFD 1.0
AREA DE TRABAJO
BARRA DE MENUS
BOTONES
La ventana principal de trabajo del Smart DFD 1.0 esta compuesta de los siguientes
elementos:
Barra de menús
Botones de Archivo
Botones de Edición
Botones de Ejecución
Botones de Depuración
Botones de Zoom
Botones de Objetos
Botones de Subprogramas
Manual Smart DFD 1.0 1
2. FUNDAMENTOS DE PROGRAMACION
Ing. Margarita María Franco López
LA BARRA DE MENUS
Aquí encontramos las siguientes opciones:
A. Archivo: Este menú se encarga del manejo del archivo que estemos trabajando.
Presenta los siguientes comandos:
N uevo: Para crear un nuevo diagrama DFD.
A brir: Para abrir un diagrama DFD guardado.
G uardar: Para guardar el diagrama DFD que se está trabajando.
G uardar como: Para guardar con un nombre diferente el diagrama DFD que se está
utilizando.
I mprimir: Para imprimir el archivo DFD abierto.
S alir: Para terminar la sesión en Smart DFD 1.0.
B. Edición: Este menú es el encargado de manejar los comandos de Edición del
diagrama:
C ortar: Para quitar un bloque del diagrama y guardarlo en el portapapeles.
C opiar: Para copiar el bloque marcado en el diagrama y guardarlo en el
portapapeles.
P egar: Para pegar en el diagrama el bloque guardado en el portapapeles.
E liminar: Para borrar el bloque marcado en el diagrama.
E liminar Subprograma: Para borrar el diagrama correspondiente a un
subprograma.
E ditar Objeto: Para cambiar las propiedades o valores del bloque marcado en el
diagrama.
C. Objeto: En este menú se establecen todos los comandos para la inserción de bloques
en el diagrama:
C ursor: Mantiene activa la opción de puntero del mouse, permitiendo desplazarse
dentro del diagrama y marcar bloques.
A signación: Permite insertar un bloque de asignación en el diagrama.
C iclo Mientras: Permite insertar una estructura repetitiva MIENTRAS en el
diagrama.
C iclo Para: Permite insertar una estructura repetitiva PARA en el diagrama.
D ecisión: Permite insertar una estructura CONDICIONAL en el diagrama.
L ectura: Permite insertar una instrucción de lectura de datos por teclado en el
diagrama.
L lamada: Para insertar la llamada a un subprograma o subrutina dentro del
diagrama.
S alida: Para insertar la presentación de datos en la pantalla.
N uevo Subprograma: Para abrir la ventana de edición para la elaboración del
diagrama de un subprograma o subrutina.
Manual Smart DFD 1.0 2
3. FUNDAMENTOS DE PROGRAMACION
Ing. Margarita María Franco López
D. Ver: Este menú habilita los siguientes comandos:
Z oom: Para ampliar o disminuir la vista general del diagrama.
A nterior Subprograma: Para ver el diagrama del anterior subprograma cuando
estos existan.
S iguiente Subprograma: Para ver el diagrama del siguiente subprograma cuando
estos existan.
D epurador: Para evaluación de expresiones y tipos de datos.
E. Ejecución: Este menú activa la ejecución del diagrama, contiene los siguientes
comandos:
E jecutar: Para iniciar la ejecución del diagrama.
P ausar: Para pausar la ejecución del diagrama.
D etener: Para interrumpir la ejecución del diagrama.
F. Depuración: Controla las actividades de depuración del diagrama. Se compone de los
siguientes comandos:
P aso Simple: Evalúa cada instrucción y bloque paso a paso e indica por que
camino va el control sobre el diagrama.
E jecutar Hasta: Permite marcar un bloque dentro del diagrama y realizar la
ejecución del diagrama solo hasta ese bloque.
D etener: Para interrumpir la depuración.
E valuar: Permite evaluar expresiones y datos.
G. Opciones: controla las opciones de trabajar los ángulos en grados o en radianes.
H. Ayuda: Invoca el manual de ayuda del SmartDfd.
LA BARRA DE BOTONES
SmartDfd se caracteriza por tener botones que activan comandos. Estos botones y
comandos son:
Botón Comando Función
Nuevo Crear un nuevo diagrama DFD.
Abrir Abrir un diagrama DFD existente.
Guardar Guardar el diagrama DFD que se está trabajando
Imprimir Imprimir el diagrama DFD que se está trabajando
Cortar Quitar un bloque del diagrama y guardarlo en el portapapeles
Copiar Copiar el bloque marcado en el diagrama y guardarlo en el
portapapeles
Pegar Pegar en el diagrama el bloque guardado en el portapapeles
Eliminar Borrar el bloque marcado en el diagrama
Manual Smart DFD 1.0 3
4. FUNDAMENTOS DE PROGRAMACION
Ing. Margarita María Franco López
Botón Comando Función
Ejecutar Iniciar la ejecución del diagrama
Detener Interrumpir la ejecución del diagrama
Pausar Pausar la ejecución del diagrama
Paso Simple Evalúa cada instrucción y bloque paso a paso e indica por
que camino va el control sobre el diagrama
Ejecutar
Hasta
Realizar la ejecución del diagrama solo hasta el bloque
marcado
Depurador Activa el depurador del diagrama
Alejar Reducir la vista del diagrama
Acercar Ampliar la vista del diagrama
Cursor Activar el puntero del mouse para desplazarse dentro del
diagrama y marcar bloques
Asignación Insertar un bloque de asignación en el diagrama
Ciclo
Mientras
Insertar una estructura repetitiva MIENTRAS en el diagrama
Ciclo Para Insertar una estructura repetitiva PARA en el diagrama
Decisión Insertar una estructura CONDICIONAL en el diagrama
Lectura Insertar una instrucción de lectura de datos por teclado en el
diagrama
Salida Insertar la presentación de datos en la pantalla
Llamada Insertar la llamada a un subprograma o subrutina dentro del
diagrama
Anterior
Subprograma
Ver el diagrama del anterior subprograma cuando estos
existan.
Siguiente
Subprograma
Ver el diagrama del siguiente subprograma cuando estos
existan
Nuevo
Subprograma
Abrir una nueva ventana de edición para la elaboración del
diagrama de un subprograma o subrutina
Eliminar
Subprograma
Borrar el diagrama correspondiente a un subprograma
Manual Smart DFD 1.0 4
5. FUNDAMENTOS DE PROGRAMACION
Ing. Margarita María Franco López
LA CREACIÓN DE DIAGRAMAS DE FLUJO EN DFD
Para crear un diagrama de flujo en Dfd deben escogerse los tipos de bloques a utilizar
pulsando sobre el botón de los siguientes:
Después de seleccionado el botón se desplaza el elemento hasta el lugar en el diagrama en
el que se desea insertar, para editar el objeto se debe pulsar doble clic con el botón del
mouse.
a. Edición de un bloque de lectura ( ): Al dar doble clic sobre este bloque aparece la
siguiente ventana:
Dentro de la casilla leer, se deben especificar las variables que van a ser leídas separadas
por coma (, ) y pulsar el botón “Aceptar”.
b. Edición de un bloque de asignación ( ): Al dar doble clic sobre este bloque aparece la
siguiente ventana:
En la casilla de la izquierda se coloca la variable que va a recibir la asignación y en la casilla
de la derecha, el valor, la variable o la operación que se va a asignar, y después se pulsa el
botón “Aceptar”. En este ejemplo se tiene una asignación A = 34 + B.
Manual Smart DFD 1.0 5
6. FUNDAMENTOS DE PROGRAMACION
Ing. Margarita María Franco López
c. Edición de un bloque de salida ( ): Al dar doble clic sobre este bloque aparece la
siguiente ventana:
Dentro de la casilla mostrar, se deben especificar las variables que van a ser mostradas en
pantalla separadas por coma (,) y pulsar el botón “Aceptar”. Si desea mostrar mensajes de
texto éstos deben ser encerrados por comillas sencillas (‘).
d. Edición de una decisión ( ): Al dar doble clic sobre este bloque aparece la siguiente
ventana:
Dentro de la casilla Condición, se debe escribir la condición que se desea evaluar, indicar si
la condición verdadera va a ser la derecha o la izquierda y pulsar el botón “Aceptar”.
e. Edición de un ciclo mientras ( ): Al dar doble clic sobre este bloque aparece la
siguiente ventana:
Manual Smart DFD 1.0 6
7. FUNDAMENTOS DE PROGRAMACION
Ing. Margarita María Franco López
Dentro de la casilla Condición, se debe escribir la condición que se desea evaluar para
realizar la repetición y pulsar el botón “Aceptar”.
f. Edición de un ciclo para ( ): Al dar doble clic sobre este bloque aparece la siguiente
ventana:
En la primera casilla (Cont) se debe indica la variable que asume como contador del ciclo, en
la segunda casilla (Vi) se escribe el valor inicial del contador; en la tercera casilla (Vf) se
indica el valor final del contador y en la última casilla (Increm ) se escribe constante del
incremento del contador; al finalizar se pulsa el botón “Aceptar”.
OPERADORES EN DFD
A. OPERADORES ARITMÉTICOS
DFD FUNCION SINTAXIS RESULTADO
+ Suma A+B La suma de A y B.
- Resta A-B La resta de A y B.
* Multiplicación A*B El producto de A y B.
/ División Real A/B El cociente real de A entre B.
TRUNC(/) División Entera TRUNC(A/B) El cociente entero de A entre B.
MOD Residuo Entero A MOD B El residuo de A entre B.
^ Exponenciación A^B A elevado a la potencia B.
B. OPERADORES RELACIONALES
Manual Smart DFD 1.0 7
8. FUNDAMENTOS DE PROGRAMACION
Ing. Margarita María Franco López
DFD FUNCION SINTAXIS RESULTADO
< Menor que X<Y V (Verdadero) si X menor que Y
F (Falso) en caso contrario.
<= Menor o igual que X<=Y V(Verdadero) si X menor o igual
a Y , F (Falso) en caso contrario
= Igual que X=Y V (Verdadero) si X es igual a Y
y F (Falso) en caso contrario
> Mayor que X>Y V (verdadero) si X mayor a Y
F (falso) en caso contrario
>= Mayor o igual que X>=Y V(Verdadero) si X mayor o igual
a Y , F (Falso) en caso contrario
!= Diferente de X!=Y V(Verdadero) si X es diferente
de Y, F(Falso) en caso contrario
C. OPERADORES LOGICOS
DFD FUNCION SINTAXIS RESULTADO
NOT Negación Lógica NOT A NOT V = F
NOT F = V
AND Conjunción
(Y Lógico)
A AND B
V AND V = V
V AND F = F
F AND V = F
F AND F = F
NAND Negación del AND A NAND B
V AND V = F
V AND F = V
F AND V = V
F AND F = V
OR Disyunción
(O Lógico)
A OR B
V AND V = V
V AND F = V
F AND V = V
F AND F = F
NOR Negación de OR A NOR B
V AND V = F
V AND F = F
F AND V = F
F AND F = V
Manual Smart DFD 1.0 8
9. FUNDAMENTOS DE PROGRAMACION
Ing. Margarita María Franco López
EQUIVALENCIA DE ESTRUCTURAS DFD CON LA SIMBOLOGIA ESTANDAR
Estructura Botón DFD Diagramas Estándar
Lectura A
Escritura A A
Asignación A=5
Condicional
Simple
Condicional
Doble
CCOONNDDIICCIIOONN
SI
A = 5
CCONDIICIION
NO
SI
A = 5
NO
A = 3
Ciclo
Mientras
CCOONNDDIICCIIOONN
SI
A = B
NO
Manual Smart DFD 1.0 9
10. FUNDAMENTOS DE PROGRAMACION
Ing. Margarita María Franco López
Estructura Botón DFD Diagramas Estándar
Ciclo Para
ii==11;; ii<<==nn;; ii++++
A = B
Manual Smart DFD 1.0 10