Descargar para leer sin conexión
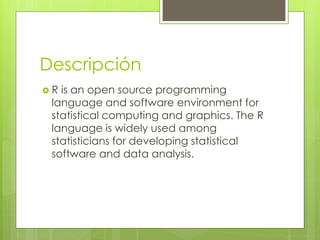

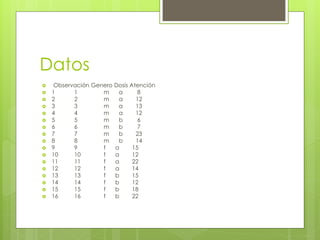
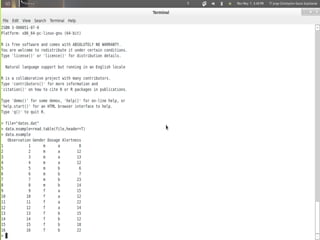
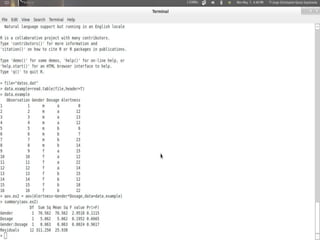
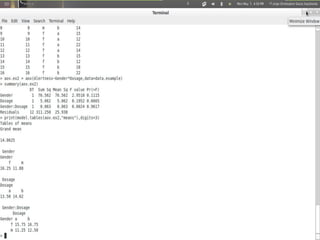
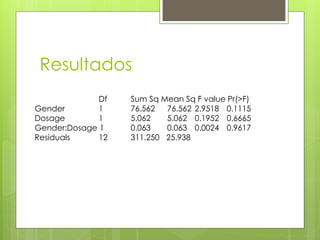


Este documento presenta información sobre el lenguaje de programación R y su uso para análisis estadístico y de datos. También describe un experimento factorial con datos sobre género, dosis y atención. Los resultados del análisis de varianza muestran que el género puede ser un factor determinante pero no la dosis o su interacción. Se incluye una bibliografía con un enlace a más información sobre R.


![[Exposicion] modelos probabilísticos aplicados](https://cdn.slidesharecdn.com/ss_thumbnails/exposicion-modelosprobabilsticosaplicados-120507225205-phpapp02-thumbnail.jpg?width=640&height=640&fit=bounds)