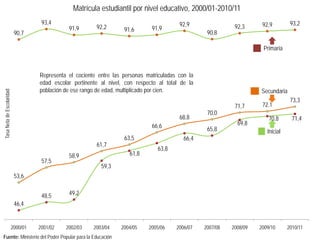
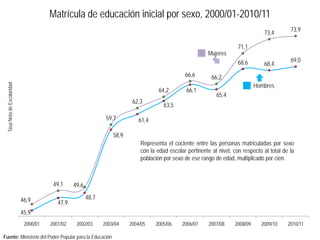
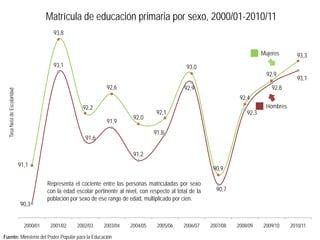
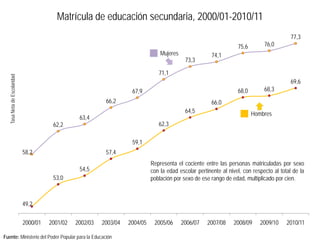
SlideShare una empresa de Scribd logo
Indicadores Educativos,
           2000/01-2010/11
• Tasas netas de escolaridad

• Indicadores de comportamiento de
  matrícula (deserción, prosecución y
  repitencia)

• Matrícula en educación universitaria

• Docentes por sexo, dependencia y
  situación laboral

• Planteles por nivel educativo


                   Enero 2012
Matrícula estudiantil por nivel educativo, 2000/01-2010/11
                                   93,4                                                        92,9                           92,9         93,2
                                               91,9         92,2       91,6        91,9                             92,3
                           90,7                                                                           90,8

                                                                                                                              Primaria


                                       Es el cociente entre las personas matriculadas en la
                                  Representa el cociente entre las personas matriculadas con la
                                  edadetapa preescolar, con laal nivel, con pertinente al nivel, de la
                                        escolar pertinente edad escolar respecto al total
                                  población de ese rango dede la población de por cien. de
                                      con respecto al total edad, multiplicado ese rango                                      Secundaria
Tasa Neta de Escolaridad


                                       edad, multiplicado por cien.                                                                        73,3
                                                                                                                    71,7      72,1
                                                                                                          70,0
                                                                                               68,8                              70,8       71,4
                                                                                   66,6                              69,8
                                                                                                          65,8                  Inicial
                                                                       63,5                      66,4
                                                            61,7
                                                                                      63,8
                                               58,9                      61,8
                                   57,5
                                                              59,3
                           53,6


                                   48,5        49,2
                           46,4


                       2000/01    2001/02     2002/03      2003/04    2004/05     2005/06     2006/07    2007/08   2008/09   2009/10      2010/11
Fuente: Ministerio del Poder Popular para la Educación
Matrícula de educación inicial por sexo, 2000/01-2010/11
                                                                                                                                    73,4        73,9

                                                                                                                         71,1
                                                                                                           Mujeres
                                                                                                                         68,6                   69,0
                                                                                                                                    68,4
                                                                                                 66,6        66,2
                                                                                                                                 Hombres
 Tasa Neta de Escolaridad


                                                                                      64,2        66,1
                                                                                                               65,4
                                                                           62,3
                                                                                        63,5

                                                                59,7          61,4

                                                                   58,9
                                                                              Representa el cociente entre las personas matriculadas por sexo
                                                                              con la edad escolar pertinente al nivel, con respecto al total de la
                                                                              población por sexo de ese rango de edad, multiplicado por cien.


                                        49,1     49,6

                            46,9                        48,7
                                          47,9
                            45,9
                             2000/01   2001/02    2002/03      2003/04    2004/05    2005/06    2006/07     2007/08    2008/09     2009/10     2010/11

Fuente: Ministerio del Poder Popular para la Educación
Matrícula de educación primaria por sexo, 2000/01-2010/11
                                          93,8


                                                                                                                                    Mujeres       93,3
                                          93,1                                                       93,0
                                                                                                                                      92,9
                                                                                                                                                  93,1
                                                                  92,6                              92,9                                92,8
 Tasa Neta de Escolaridad


                                                                                                                          92,4
                                                       92,2                                                                          Hombres
                                                                                        92,1                                 92,3
                                                                              92,0
                                                                  91,9
                                                                                       91,8
                                                        91,6

                                                                              91,2
                            91,1
                                                                                                                90,9

                                        Representa el cociente entre las personas matriculadas por sexo
                                        con la edad escolar pertinente al nivel, con respecto al total de la     90,7
                                        población por sexo de ese rango de edad, multiplicado por cien.
                            90,3


                              2000/01    2001/02     2002/03     2003/04    2004/05     2005/06     2006/07    2007/08   2008/09    2009/10    2010/11

Fuente: Ministerio del Poder Popular para la Educación
Matrícula de educación secundaria, 2000/01-2010/11
                                                                                                                                             77,3
                                                                                                                     75,6        76,0
                                                                                   Mujeres               74,1
                                                                                              73,3

                                                                                  71,1
  Tasa Neta de Escolaridad


                                                                                                                                             69,6
                                                                      67,9                                           68,0        68,3
                                                            66,2                                         66,0
                                                                                              64,5                          Hombres
                                                  63,4
                                        62,2                                      62,3

                                                                      59,1
                             58,2                           57,4
                                                                               Representa el cociente entre las personas matriculadas por sexo
                                                  54,5                         con la edad escolar pertinente al nivel, con respecto al total de la
                                        53,0                                   población por sexo de ese rango de edad, multiplicado por cien.


                             49,2

                             2000/01   2001/02   2002/03   2003/04   2004/05    2005/06      2006/07    2007/08    2008/09     2009/10     2010/11

Fuente: Ministerio del Poder Popular para la Educación
Deserción escolar por nivel educativo, 2000/01-2009/10
                          15,2


                                                               Se entiende por Deserción la cantidad de estudiantes que se van
                                                               del sistema y que no reingresan en el año siguiente. La diferencia
                                                               con el abandono radica en que estos ingresan de nuevo, es decir,
                                                               pudiera decirse que el abandono es una deserción parcial o
          11,5                             10,9           10,8 temporal.
                                                                       9,8
                                                                                   9,1                                   9,0
                                                                                                8,6
                                                                                                            8,2
   Tasa


                                                                                                                                     7,4
                                                                                                                     Secundaria


                           3,8                                                                  4,0


                                                                                 Primaria
                                         1,8              1,6          1,6                                  1,7          1,6
                                                                                                                                     0,9

          0,4                                                                      0,0

           2000/01       2001/02       2002/03           2003/04     2004/05     2005/06      2006/07     2007/08      2008/09      2009/10

Fuente: Ministerio del Poder Popular para la Educación
Prosecución escolar por nivel educativo, 2000/01-2009/10

                                                                                                                                   95,5
                                                                                   95,0                      94,8         94,6

                                                                    92,3                       92,7
            91,8                                          91,6                                                      Primaria
                                         90,9

                          88,8
                                                                                               88,1
                                                                                                             86,9                  87,0
                                                                                   85,9
 Tasa


                                                                                                                          85,2
                                                                                                Secundaria

                                                                    82,2

                                                          80,3
                                         79,5                                La Prosecución es uno de los indicadores más importante
                                                                             para medir la evolución del sistema educativo de un país,
            77,5                                                             muestra con certeza la cantidad de matrícula que prosigue,
                                                                             continúa, avanza de un grado a otro.

                          74,8


          2000/01        2001/02       2002/03           2003/04   2004/05        2005/06     2006/07     2007/08       2008/09   2009/10

Fuente: Ministerio del Poder Popular para la Educación
Repitencia escolar por nivel educativo, 2000/01-2009/10

            11,0

                                                                       Los repitientes se relacionan con la matrícula del mismo año
                           10,0                                        escolar.
                                          9,6

                                                          8,9


             7,8                                                      7,9
                                                                               Secundaria
Tasa


                           7,4            7,4

                                                          6,8

                                                                      6,1
                                                                                                                         5,8
                                                                                                                                       5,6
                                                          Primaria
                                                                                   5,0                      4,9
                                                                                4,9

                                                                                                                         3,7           3,6
                                                                                                            3,5
                                                                                               3,4
                                                                                             3,3
           2000/01       2001/02        2002/03          2003/04     2004/05     2005/06      2006/07      2007/08      2008/09       2009/10
Fuente: Ministerio del Poder Popular para la Educación
Índice de paridad entre niñas y niños por nivel educativo,
                                          2000/01-2010/11
            1,130
                        1,117
                                     1,106
                                                  1,096
                                                               1,086
                                                                             1,081
                                                                                          1,073
                                                                                                        1,059
                                                                                                                     1,051     1,053     1,050
 Cociente


                                              Relación entre niñas y niños. Un índice de paridad igual a 1, indica
                                              paridad entre niñas y niños. Un valor menor que 1 indica una
                                              desigualdad a favor de niños, en tanto que un valor mayor que 1,
                                              indica una desigualdad a favor de niñas.


            0,942       0,940        0,939        0,940        0,940         0,936        0,933         0,933        0,934     0,932     0,935


            2000/01    2001/02      2002/03      2003/04      2004/05       2005/06       2006/07      2007/08       2008/09   2009/10   2010/11

Fuente: Ministerio del Poder Popular para la Educación
Docentes por sexo, dependencia y situación laboral, 2010/11

                                                         449.500
                                       424.722
                                                                                                  Total Nacional: 546.664


                                                                                            306.369
 Número de Docentes


                                                                                                             173.475

                      121.942
                                                                              97.164
                                                                                                                              66.820


                      Hombres          Mujeres            Oficial                 Privada    Titular          Interino         Otro

                                Sexo                                Dependencia                           Situación Laboral


Fuente: Ministerio del Poder Popular para la Educación
Planteles por nivel educativo, 2010/11
                                              18.599
                      17.184


                                                                        Total Nacional: 26.591
Número de Planteles


                                                            4.890


                                                                           884
                                                                                                     65

                                                          1° a 6° año   1° a 3° año              4° a 6° año

                      Inicial                  Primaria                   Media

 Fuente: Ministerio del Poder Popular para la Educación
Matrícula de educación universitaria en pregrado y postgrado,
                                                  2000-2010                                                                        2.293.914


                                                                                                          2.109.331    2.120.231

                                                                                             2.015.140


                                                                                 1.813.970
  Estudiantes


                                                                    1.418.303


                                                            1.170.392

                                                1.056.878
                                    1.014.006
                          900.006
                894.418


                  2000       2001     2002         2003          2004         2005      2006       2007         2008        2009    2010

Fuente: Ministerio del Poder Popular para la Educación Universitaria, MPPEU

Más contenido relacionado

Destacado

2024 State of Marketing Report – by Hubspot
2024 State of Marketing Report – by Hubspot2024 State of Marketing Report – by Hubspot
2024 State of Marketing Report – by Hubspot
Marius Sescu
 
Everything You Need To Know About ChatGPT
Everything You Need To Know About ChatGPTEverything You Need To Know About ChatGPT
Everything You Need To Know About ChatGPT
Expeed Software
 
Product Design Trends in 2024 | Teenage Engineerings
Product Design Trends in 2024 | Teenage EngineeringsProduct Design Trends in 2024 | Teenage Engineerings
Product Design Trends in 2024 | Teenage Engineerings
Pixeldarts
 
How Race, Age and Gender Shape Attitudes Towards Mental Health
How Race, Age and Gender Shape Attitudes Towards Mental HealthHow Race, Age and Gender Shape Attitudes Towards Mental Health
How Race, Age and Gender Shape Attitudes Towards Mental Health
ThinkNow
 
AI Trends in Creative Operations 2024 by Artwork Flow.pdf
AI Trends in Creative Operations 2024 by Artwork Flow.pdfAI Trends in Creative Operations 2024 by Artwork Flow.pdf
AI Trends in Creative Operations 2024 by Artwork Flow.pdf
marketingartwork
 
Skeleton Culture Code
Skeleton Culture CodeSkeleton Culture Code
Skeleton Culture Code
Skeleton Technologies
 
PEPSICO Presentation to CAGNY Conference Feb 2024
PEPSICO Presentation to CAGNY Conference Feb 2024PEPSICO Presentation to CAGNY Conference Feb 2024
PEPSICO Presentation to CAGNY Conference Feb 2024
Neil Kimberley
 
Content Methodology: A Best Practices Report (Webinar)
Content Methodology: A Best Practices Report (Webinar)Content Methodology: A Best Practices Report (Webinar)
Content Methodology: A Best Practices Report (Webinar)
contently
 
How to Prepare For a Successful Job Search for 2024
How to Prepare For a Successful Job Search for 2024How to Prepare For a Successful Job Search for 2024
How to Prepare For a Successful Job Search for 2024
Albert Qian
 
Social Media Marketing Trends 2024 // The Global Indie Insights
Social Media Marketing Trends 2024 // The Global Indie InsightsSocial Media Marketing Trends 2024 // The Global Indie Insights
Social Media Marketing Trends 2024 // The Global Indie Insights
Kurio // The Social Media Age(ncy)
 
Trends In Paid Search: Navigating The Digital Landscape In 2024
Trends In Paid Search: Navigating The Digital Landscape In 2024Trends In Paid Search: Navigating The Digital Landscape In 2024
Trends In Paid Search: Navigating The Digital Landscape In 2024
Search Engine Journal
 
5 Public speaking tips from TED - Visualized summary
5 Public speaking tips from TED - Visualized summary5 Public speaking tips from TED - Visualized summary
5 Public speaking tips from TED - Visualized summary
SpeakerHub
 
ChatGPT and the Future of Work - Clark Boyd
ChatGPT and the Future of Work - Clark Boyd ChatGPT and the Future of Work - Clark Boyd
ChatGPT and the Future of Work - Clark Boyd
Clark Boyd
 
Getting into the tech field. what next
Getting into the tech field. what next Getting into the tech field. what next
Getting into the tech field. what next
Tessa Mero
 
Google's Just Not That Into You: Understanding Core Updates & Search Intent
Google's Just Not That Into You: Understanding Core Updates & Search IntentGoogle's Just Not That Into You: Understanding Core Updates & Search Intent
Google's Just Not That Into You: Understanding Core Updates & Search Intent
Lily Ray
 
How to have difficult conversations
How to have difficult conversations How to have difficult conversations
How to have difficult conversations
Rajiv Jayarajah, MAppComm, ACC
 
Introduction to Data Science
Introduction to Data ScienceIntroduction to Data Science
Introduction to Data Science
Christy Abraham Joy
 
Time Management & Productivity - Best Practices
Time Management & Productivity -  Best PracticesTime Management & Productivity -  Best Practices
Time Management & Productivity - Best Practices
Vit Horky
 
The six step guide to practical project management
The six step guide to practical project managementThe six step guide to practical project management
The six step guide to practical project management
MindGenius
 
Beginners Guide to TikTok for Search - Rachel Pearson - We are Tilt __ Bright...
Beginners Guide to TikTok for Search - Rachel Pearson - We are Tilt __ Bright...Beginners Guide to TikTok for Search - Rachel Pearson - We are Tilt __ Bright...
Beginners Guide to TikTok for Search - Rachel Pearson - We are Tilt __ Bright...
RachelPearson36
 

Destacado (20)

2024 State of Marketing Report – by Hubspot
2024 State of Marketing Report – by Hubspot2024 State of Marketing Report – by Hubspot
2024 State of Marketing Report – by Hubspot
 
Everything You Need To Know About ChatGPT
Everything You Need To Know About ChatGPTEverything You Need To Know About ChatGPT
Everything You Need To Know About ChatGPT
 
Product Design Trends in 2024 | Teenage Engineerings
Product Design Trends in 2024 | Teenage EngineeringsProduct Design Trends in 2024 | Teenage Engineerings
Product Design Trends in 2024 | Teenage Engineerings
 
How Race, Age and Gender Shape Attitudes Towards Mental Health
How Race, Age and Gender Shape Attitudes Towards Mental HealthHow Race, Age and Gender Shape Attitudes Towards Mental Health
How Race, Age and Gender Shape Attitudes Towards Mental Health
 
AI Trends in Creative Operations 2024 by Artwork Flow.pdf
AI Trends in Creative Operations 2024 by Artwork Flow.pdfAI Trends in Creative Operations 2024 by Artwork Flow.pdf
AI Trends in Creative Operations 2024 by Artwork Flow.pdf
 
Skeleton Culture Code
Skeleton Culture CodeSkeleton Culture Code
Skeleton Culture Code
 
PEPSICO Presentation to CAGNY Conference Feb 2024
PEPSICO Presentation to CAGNY Conference Feb 2024PEPSICO Presentation to CAGNY Conference Feb 2024
PEPSICO Presentation to CAGNY Conference Feb 2024
 
Content Methodology: A Best Practices Report (Webinar)
Content Methodology: A Best Practices Report (Webinar)Content Methodology: A Best Practices Report (Webinar)
Content Methodology: A Best Practices Report (Webinar)
 
How to Prepare For a Successful Job Search for 2024
How to Prepare For a Successful Job Search for 2024How to Prepare For a Successful Job Search for 2024
How to Prepare For a Successful Job Search for 2024
 
Social Media Marketing Trends 2024 // The Global Indie Insights
Social Media Marketing Trends 2024 // The Global Indie InsightsSocial Media Marketing Trends 2024 // The Global Indie Insights
Social Media Marketing Trends 2024 // The Global Indie Insights
 
Trends In Paid Search: Navigating The Digital Landscape In 2024
Trends In Paid Search: Navigating The Digital Landscape In 2024Trends In Paid Search: Navigating The Digital Landscape In 2024
Trends In Paid Search: Navigating The Digital Landscape In 2024
 
5 Public speaking tips from TED - Visualized summary
5 Public speaking tips from TED - Visualized summary5 Public speaking tips from TED - Visualized summary
5 Public speaking tips from TED - Visualized summary
 
ChatGPT and the Future of Work - Clark Boyd
ChatGPT and the Future of Work - Clark Boyd ChatGPT and the Future of Work - Clark Boyd
ChatGPT and the Future of Work - Clark Boyd
 
Getting into the tech field. what next
Getting into the tech field. what next Getting into the tech field. what next
Getting into the tech field. what next
 
Google's Just Not That Into You: Understanding Core Updates & Search Intent
Google's Just Not That Into You: Understanding Core Updates & Search IntentGoogle's Just Not That Into You: Understanding Core Updates & Search Intent
Google's Just Not That Into You: Understanding Core Updates & Search Intent
 
How to have difficult conversations
How to have difficult conversations How to have difficult conversations
How to have difficult conversations
 
Introduction to Data Science
Introduction to Data ScienceIntroduction to Data Science
Introduction to Data Science
 
Time Management & Productivity - Best Practices
Time Management & Productivity -  Best PracticesTime Management & Productivity -  Best Practices
Time Management & Productivity - Best Practices
 
The six step guide to practical project management
The six step guide to practical project managementThe six step guide to practical project management
The six step guide to practical project management
 
Beginners Guide to TikTok for Search - Rachel Pearson - We are Tilt __ Bright...
Beginners Guide to TikTok for Search - Rachel Pearson - We are Tilt __ Bright...Beginners Guide to TikTok for Search - Rachel Pearson - We are Tilt __ Bright...
Beginners Guide to TikTok for Search - Rachel Pearson - We are Tilt __ Bright...
 

Indicadores de Educación período 2010/2011

  • 1. Indicadores Educativos, 2000/01-2010/11 • Tasas netas de escolaridad • Indicadores de comportamiento de matrícula (deserción, prosecución y repitencia) • Matrícula en educación universitaria • Docentes por sexo, dependencia y situación laboral • Planteles por nivel educativo Enero 2012
  • 2. Matrícula estudiantil por nivel educativo, 2000/01-2010/11 93,4 92,9 92,9 93,2 91,9 92,2 91,6 91,9 92,3 90,7 90,8 Primaria Es el cociente entre las personas matriculadas en la Representa el cociente entre las personas matriculadas con la edadetapa preescolar, con laal nivel, con pertinente al nivel, de la escolar pertinente edad escolar respecto al total población de ese rango dede la población de por cien. de con respecto al total edad, multiplicado ese rango Secundaria Tasa Neta de Escolaridad edad, multiplicado por cien. 73,3 71,7 72,1 70,0 68,8 70,8 71,4 66,6 69,8 65,8 Inicial 63,5 66,4 61,7 63,8 58,9 61,8 57,5 59,3 53,6 48,5 49,2 46,4 2000/01 2001/02 2002/03 2003/04 2004/05 2005/06 2006/07 2007/08 2008/09 2009/10 2010/11 Fuente: Ministerio del Poder Popular para la Educación
  • 3. Matrícula de educación inicial por sexo, 2000/01-2010/11 73,4 73,9 71,1 Mujeres 68,6 69,0 68,4 66,6 66,2 Hombres Tasa Neta de Escolaridad 64,2 66,1 65,4 62,3 63,5 59,7 61,4 58,9 Representa el cociente entre las personas matriculadas por sexo con la edad escolar pertinente al nivel, con respecto al total de la población por sexo de ese rango de edad, multiplicado por cien. 49,1 49,6 46,9 48,7 47,9 45,9 2000/01 2001/02 2002/03 2003/04 2004/05 2005/06 2006/07 2007/08 2008/09 2009/10 2010/11 Fuente: Ministerio del Poder Popular para la Educación
  • 4. Matrícula de educación primaria por sexo, 2000/01-2010/11 93,8 Mujeres 93,3 93,1 93,0 92,9 93,1 92,6 92,9 92,8 Tasa Neta de Escolaridad 92,4 92,2 Hombres 92,1 92,3 92,0 91,9 91,8 91,6 91,2 91,1 90,9 Representa el cociente entre las personas matriculadas por sexo con la edad escolar pertinente al nivel, con respecto al total de la 90,7 población por sexo de ese rango de edad, multiplicado por cien. 90,3 2000/01 2001/02 2002/03 2003/04 2004/05 2005/06 2006/07 2007/08 2008/09 2009/10 2010/11 Fuente: Ministerio del Poder Popular para la Educación
  • 5. Matrícula de educación secundaria, 2000/01-2010/11 77,3 75,6 76,0 Mujeres 74,1 73,3 71,1 Tasa Neta de Escolaridad 69,6 67,9 68,0 68,3 66,2 66,0 64,5 Hombres 63,4 62,2 62,3 59,1 58,2 57,4 Representa el cociente entre las personas matriculadas por sexo 54,5 con la edad escolar pertinente al nivel, con respecto al total de la 53,0 población por sexo de ese rango de edad, multiplicado por cien. 49,2 2000/01 2001/02 2002/03 2003/04 2004/05 2005/06 2006/07 2007/08 2008/09 2009/10 2010/11 Fuente: Ministerio del Poder Popular para la Educación
  • 6. Deserción escolar por nivel educativo, 2000/01-2009/10 15,2 Se entiende por Deserción la cantidad de estudiantes que se van del sistema y que no reingresan en el año siguiente. La diferencia con el abandono radica en que estos ingresan de nuevo, es decir, pudiera decirse que el abandono es una deserción parcial o 11,5 10,9 10,8 temporal. 9,8 9,1 9,0 8,6 8,2 Tasa 7,4 Secundaria 3,8 4,0 Primaria 1,8 1,6 1,6 1,7 1,6 0,9 0,4 0,0 2000/01 2001/02 2002/03 2003/04 2004/05 2005/06 2006/07 2007/08 2008/09 2009/10 Fuente: Ministerio del Poder Popular para la Educación
  • 7. Prosecución escolar por nivel educativo, 2000/01-2009/10 95,5 95,0 94,8 94,6 92,3 92,7 91,8 91,6 Primaria 90,9 88,8 88,1 86,9 87,0 85,9 Tasa 85,2 Secundaria 82,2 80,3 79,5 La Prosecución es uno de los indicadores más importante para medir la evolución del sistema educativo de un país, 77,5 muestra con certeza la cantidad de matrícula que prosigue, continúa, avanza de un grado a otro. 74,8 2000/01 2001/02 2002/03 2003/04 2004/05 2005/06 2006/07 2007/08 2008/09 2009/10 Fuente: Ministerio del Poder Popular para la Educación
  • 8. Repitencia escolar por nivel educativo, 2000/01-2009/10 11,0 Los repitientes se relacionan con la matrícula del mismo año 10,0 escolar. 9,6 8,9 7,8 7,9 Secundaria Tasa 7,4 7,4 6,8 6,1 5,8 5,6 Primaria 5,0 4,9 4,9 3,7 3,6 3,5 3,4 3,3 2000/01 2001/02 2002/03 2003/04 2004/05 2005/06 2006/07 2007/08 2008/09 2009/10 Fuente: Ministerio del Poder Popular para la Educación
  • 9. Índice de paridad entre niñas y niños por nivel educativo, 2000/01-2010/11 1,130 1,117 1,106 1,096 1,086 1,081 1,073 1,059 1,051 1,053 1,050 Cociente Relación entre niñas y niños. Un índice de paridad igual a 1, indica paridad entre niñas y niños. Un valor menor que 1 indica una desigualdad a favor de niños, en tanto que un valor mayor que 1, indica una desigualdad a favor de niñas. 0,942 0,940 0,939 0,940 0,940 0,936 0,933 0,933 0,934 0,932 0,935 2000/01 2001/02 2002/03 2003/04 2004/05 2005/06 2006/07 2007/08 2008/09 2009/10 2010/11 Fuente: Ministerio del Poder Popular para la Educación
  • 10. Docentes por sexo, dependencia y situación laboral, 2010/11 449.500 424.722 Total Nacional: 546.664 306.369 Número de Docentes 173.475 121.942 97.164 66.820 Hombres Mujeres Oficial Privada Titular Interino Otro Sexo Dependencia Situación Laboral Fuente: Ministerio del Poder Popular para la Educación
  • 11. Planteles por nivel educativo, 2010/11 18.599 17.184 Total Nacional: 26.591 Número de Planteles 4.890 884 65 1° a 6° año 1° a 3° año 4° a 6° año Inicial Primaria Media Fuente: Ministerio del Poder Popular para la Educación
  • 12. Matrícula de educación universitaria en pregrado y postgrado, 2000-2010 2.293.914 2.109.331 2.120.231 2.015.140 1.813.970 Estudiantes 1.418.303 1.170.392 1.056.878 1.014.006 900.006 894.418 2000 2001 2002 2003 2004 2005 2006 2007 2008 2009 2010 Fuente: Ministerio del Poder Popular para la Educación Universitaria, MPPEU