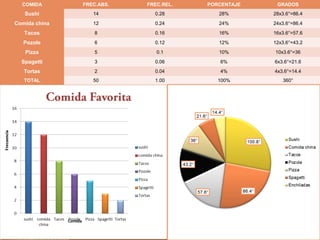
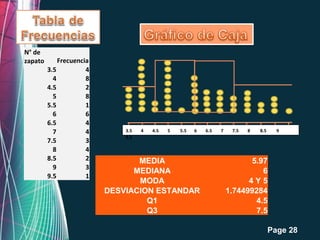
Free Powerpoint Templates
                            Page 1
Free Powerpoint Templates
                            Page 2
Sexo
                    Hobbie
                    Posesión de Pareja
                    Música favorita
                    Color favorito
                    Materia favorita
                    Comida favorita
                    Deporte Favorito
                    Peso
                    Estatura
                    Promedio
                    # de calzado
                    # de integrantes en la familia
                    Materia de psicología

Free Powerpoint Templates
                                      Page 3
 ¿Tienes pareja?
    ¿Tienes pareja?
    ¿Cuál es tu tipo de música favorito?
    ¿Cuál es tu tipo de música favorito?
    ¿Cuál es tu color favorito?
    ¿Cuál es tu color favorito?
    ¿Cuál es tu materia favorita?
    ¿Cuál es tu materia favorita?
    ¿Cuál es tu comida favorita?
    ¿Cuál es tu comida favorita?
    ¿Cuál es tu deporte favorito?
    ¿Cuál es tu deporte favorito?
    ¿¿Cual es tu hobbie?
    Cual es tu hobbie?
    ¿Cuánto pesas?
    ¿Cuánto pesas?
    ¿Cuánto mides?
    ¿Cuánto mides?
    ¿Cuál es tu promedio?
    ¿Cuál es tu promedio?
    ¿¿De qué número calzas?
    De qué número calzas?
    ¿Cuántos integrantes hay en tu familia?
    ¿Cuántos integrantes hay en tu familia?
    En una escala del 1 al 10, ¿Cuánto te
    En una escala del 1 al 10, ¿Cuánto te
     gusta la materia de psicología?
      gusta la materia de psicología?
Free Powerpoint Templates
                                   Page 4
Free Powerpoint Templates
                            Page 5
SEXO       FREC.ABS.   FREC.REL.   PORCENTAJE   GRADOS

Femenino       27          0.54         54%       194.4°
Masculino      23          0.46         46%       165.6°
 TOTAL         50         100%         100%        360°


             Free Powerpoint Templates
                                                       Page 6
Free Powerpoint Templates
                            Page 7
¿TIENES
          FREC.ABS.   FREC.REL.   PORCENTAJE   GRADOS
PAREJA?
   Si        17         0.34          34%       122.4°
   No        33         0.66          66%       237.6°
 TOTAL       50         1.00         100%        360°


  Free Powerpoint Templates
                                            Page 8
Free Powerpoint Templates
                            Page 9
Free Powerpoint Templates
                            Page 10
Free Powerpoint Templates
                            Page 11
INTERVALO
    S        f
  [43,50)    3
  [50,57)    11
  [57,64)    12
  [64,71)    11
  [71,78)    6
  [78,85     4
  [85,92)    3
 TOTAL       50


            Free Powerpoint Templates
                                        Page 12
Free Powerpoint Templates
                            Page 13
INTERVALOS        f

[1.50, 1.60)      9

[1.60, 1.70)      24

[1.70,1.80)       14

[1.80, 1.90)      3

 TOTAL            50


                        MEDIA                 1.6648
                       MEDIANA                  1.65
                        MODA                    1.65
               DESVIACION ESTANDAR             0.077
                  Free Powerpoint Templates
                                                       Page 14
Free Powerpoint Templates
                            Page 15
MEDIA                    8.992
                                      MEDIANA                      9
                                       MODA                        9
                               DESVIACION ESTANDAR             0.7122

INTERVALOS    f

 [7.0,7.4)    2

 [7.4,7.8)    0

 [7.8,8.2)    6

 [8.2,8.6)    5

 [8.6,9.0)    4

 [9.0,9.4)    15

 [9.4,9.8)    9

 [9.8,10.2)   9
                   Free Powerpoint Templates
                                                     Page 16
 TOTAL        50
Free Powerpoint Templates
                            Page 17
# de Integrantes   Frecuencia
3                  2
4                  12
5                  25
6                  10
7                  1
TOTAL              50


         MEDIA              4.92
        MEDIANA               5
         MODA                 5
      DESVIACION
       ESTANDAR            0.83
          Q1                  4
          Q3                  5
             Free Powerpoint Templates
                                         Page 18
Free Powerpoint Templates
                            Page 19
MÚSICA FAVORITA   FREC. ABS         FREC. REL.      PORCENTAJE     GRADOS

    Corridos          6                0.12               12%       43.2°
     Banda           10                0.2                20%        72°
   Ranchera           4                0.08               8%        28.8°
      Pop            23                0.46               46%       165.6°
     Rock             2                0.04               4%        14.4°
    Norteño           4                0.08               8%        28.8°
    Reggae            1                0.02               2%         7.2°
    TOTAL            50                1.00            100%         360°


                              Free Powerpoint Templates
                                                                 Page 20
Free Powerpoint Templates
                            Page 21
COMIDA       FREC.ABS.         FREC.REL.       PORCENTAJE     GRADOS
   Sushi          14               0.28                28%     28x3.6°=86.4

Comida china      12               0.24                24%     24x3.6°=86.4

   Tacos           8               0.16                16%     16x3.6°=57.6

   Pozole          6               0.12                12%     12x3.6°=43.2

   Pizza           5                0.1                10%     10x3.6°=36

  Spagetti         3               0.06                6%      6x3.6°=21.6
   Tortas          2               0.04                4%      4x3.6°=14.4
   TOTAL          50               1.00             100%          360°


                           Free Powerpoint Templates
                                                              Page 22
Free Powerpoint Templates
                            Page 23
COLOR FAVORITO   FREC. ABS.         FREC. REL.      PORCENTAJE     GRADOS

    Verde            4                0.08              8%          28.8°
     Rojo            9                0.18             18%          64.8°
     Azul           14                0.28             28%         100.8°
   Amarillo          3                0.06              6%          21.6°
   Morado            9                0.18             18%          64.8°
    Negro            2                0.04              4%          14.4°
     Rosa            7                0.14             14%          50.4°
    Blanco           2                0.04              4%          14.4°
    TOTAL           50                1.00            100%          360°


                              Free Powerpoint Templates
                                                                 Page 24
Free Powerpoint Templates
                            Page 25
DEPORTE FAVORITO   FREC. ABS.         FREC. REL.          PORCENTAJE          GRADOS
      FUTBOL                     20                 0.4                 40%             144
     NATACIÓN                    12                0.24                 24%            86.4
   BASKETBALL                     5                 0.1                 10%              36
     AJEDREZ                      2                0.04                  4%            14.4
    VOLEYBALL                     4                0.08                  8%            28.8
    BASEBALL                      5                 0.1                 10%              36
                           Free Powerpoint Templates
 ARTES MARCIALES                  2                0.04                 Page 26
                                                                         4%            14.4
       TOTAL                     50                   1                100%            360°
Free Powerpoint Templates
                            Page 27
N° de
zapato       Frecuencia
         3.5          4
           4          8
         4.5          2
           5          8
         5.5          1
           6          6
         6.5          4
           7          4       3.5   4   4.5   5   5.5   6   6.5   7    7.5   8   8.5     9
                              9.5
         7.5          3
           8          4
         8.5          2          MEDIA                                      5.97
           9          3
                                MEDIANA                                        6
         9.5          1
                                 MODA                                       4Y5
                          DESVIACION ESTANDAR                         1.74499284
                                   Q1                                        4.5
                                   Q3                                        7.5
                             Free Powerpoint Templates
                                                                                       Page 28
Free Powerpoint Templates
                            Page 29
Free Powerpoint Templates
                            Page 30
Free Powerpoint Templates
                            Page 31
¿Qué haces en tu tiempo libre?        Frec. Abs.        Frec. Rel.          Porcentaje          Grados
Deportes                                           13                0.26                  26%       93.6°
Leer                                                4                0.08                   8%       28.8°
Escuchar música                                     3                0.06                   6%       21.6°
Ver TV                                              7                0.14                1.40%       50.4°
Salir con amigos                                    2                0.04                   4%       14.4°
Shopping                                            3                0.06                   6%       21.6°
Chat                                                8                0.16                  16%       57.6°
Yoga                                                1                0.02                   2%         7.2°
Estudiar                                            6                0.12                  12%       43.2°
Clases de ingles                                    3                0.06                   6%       21.6°
Total                                              50                   1                   100        360°


                                 Free Powerpoint Templates
                                                                                         Page 32
Free Powerpoint Templates
                            Page 33
X       FRECUENCIA
2            4
4            1
5            7
6            5
7            2
8            12
9            4
10           15
Total        50
                             1   2   3   4   5   6   7   8   9   10

                     MEDIA                           7.46
                  MEDIANA                               8
                    MODA                               10
            DESVIACION ESTANDAR                      2.45
                     Q1                                 6
                     Q3                                10
               Free Powerpoint Templates
                                                         Page 34
Como es el alumno típico de 3-04 fue el objetivo a alcanzar en
esta investigación la cual realizamos por medio de encuestas
para la recolección de datos y luego su interpretación de los
mismos datos por medio de graficas ya sea de pastel, barras o
de caja. Los resultados fueron los siguientes…
                      1. Sexo – Femenino
                       1. Sexo – Femenino
                      2. Posesión de pareja- mas de la mitad no tiene pareja
                       2. Posesión de pareja- mas de la mitad no tiene pareja
                      3. Promedio= 9 yypreferencia (psicología)= 7.5
                       3. Promedio= 9 preferencia (psicología)= 7.5
                      4. Peso- moda= 60.5
                       4. Peso- moda= 60.5
                      5. Estatura = 1,65
                       5. Estatura = 1,65
                      6. Promedio general- moda= 9
                       6. Promedio general- moda= 9
                      7. # de integrantes de la familia- domino= 55
                       7. # de integrantes de la familia- domino=
                      8. Música Favorita= POP
                       8. Música Favorita= POP
                      9. Comida Favorita= SUSHI
                       9. Comida Favorita= SUSHI
                      10. Color Favorito= Azul
                       10. Color Favorito= Azul
                      11. Deporte= Futbol
                       11. Deporte= Futbol
                      12. # de calzado= 4 y 55
                       12. # de calzado= 4 y
                      13. Materia Favorita= Psicología
                       13. Materia Favorita= Psicología
                      14. Hobbie= Deporte
                       14. Hobbie= Deporte
                       Free Powerpoint Templates
                                                                 Page 35
                      15. Gusto en Psicología= 88
                       15. Gusto en Psicología=

Proyecto

  • 1.
  • 2.
  • 3.
    Sexo Hobbie Posesión de Pareja Música favorita Color favorito Materia favorita Comida favorita Deporte Favorito Peso Estatura Promedio # de calzado # de integrantes en la familia Materia de psicología Free Powerpoint Templates Page 3
  • 4.
     ¿Tienes pareja?  ¿Tienes pareja?  ¿Cuál es tu tipo de música favorito?  ¿Cuál es tu tipo de música favorito?  ¿Cuál es tu color favorito?  ¿Cuál es tu color favorito?  ¿Cuál es tu materia favorita?  ¿Cuál es tu materia favorita?  ¿Cuál es tu comida favorita?  ¿Cuál es tu comida favorita?  ¿Cuál es tu deporte favorito?  ¿Cuál es tu deporte favorito?  ¿¿Cual es tu hobbie?  Cual es tu hobbie?  ¿Cuánto pesas?  ¿Cuánto pesas?  ¿Cuánto mides?  ¿Cuánto mides?  ¿Cuál es tu promedio?  ¿Cuál es tu promedio?  ¿¿De qué número calzas?  De qué número calzas?  ¿Cuántos integrantes hay en tu familia?  ¿Cuántos integrantes hay en tu familia?  En una escala del 1 al 10, ¿Cuánto te  En una escala del 1 al 10, ¿Cuánto te gusta la materia de psicología? gusta la materia de psicología? Free Powerpoint Templates Page 4
  • 5.
  • 6.
    SEXO FREC.ABS. FREC.REL. PORCENTAJE GRADOS Femenino 27 0.54 54% 194.4° Masculino 23 0.46 46% 165.6° TOTAL 50 100% 100% 360° Free Powerpoint Templates Page 6
  • 7.
  • 8.
    ¿TIENES FREC.ABS. FREC.REL. PORCENTAJE GRADOS PAREJA? Si 17 0.34 34% 122.4° No 33 0.66 66% 237.6° TOTAL 50 1.00 100% 360° Free Powerpoint Templates Page 8
  • 9.
  • 10.
  • 11.
  • 12.
    INTERVALO S f [43,50) 3 [50,57) 11 [57,64) 12 [64,71) 11 [71,78) 6 [78,85 4 [85,92) 3 TOTAL 50 Free Powerpoint Templates Page 12
  • 13.
  • 14.
    INTERVALOS f [1.50, 1.60) 9 [1.60, 1.70) 24 [1.70,1.80) 14 [1.80, 1.90) 3 TOTAL 50 MEDIA 1.6648 MEDIANA 1.65 MODA 1.65 DESVIACION ESTANDAR 0.077 Free Powerpoint Templates Page 14
  • 15.
  • 16.
    MEDIA 8.992 MEDIANA 9 MODA 9 DESVIACION ESTANDAR 0.7122 INTERVALOS f [7.0,7.4) 2 [7.4,7.8) 0 [7.8,8.2) 6 [8.2,8.6) 5 [8.6,9.0) 4 [9.0,9.4) 15 [9.4,9.8) 9 [9.8,10.2) 9 Free Powerpoint Templates Page 16 TOTAL 50
  • 17.
  • 18.
    # de Integrantes Frecuencia 3 2 4 12 5 25 6 10 7 1 TOTAL 50 MEDIA 4.92 MEDIANA 5 MODA 5 DESVIACION ESTANDAR 0.83 Q1 4 Q3 5 Free Powerpoint Templates Page 18
  • 19.
  • 20.
    MÚSICA FAVORITA FREC. ABS FREC. REL. PORCENTAJE GRADOS Corridos 6 0.12 12% 43.2° Banda 10 0.2 20% 72° Ranchera 4 0.08 8% 28.8° Pop 23 0.46 46% 165.6° Rock 2 0.04 4% 14.4° Norteño 4 0.08 8% 28.8° Reggae 1 0.02 2% 7.2° TOTAL 50 1.00 100% 360° Free Powerpoint Templates Page 20
  • 21.
  • 22.
    COMIDA FREC.ABS. FREC.REL. PORCENTAJE GRADOS Sushi 14 0.28 28% 28x3.6°=86.4 Comida china 12 0.24 24% 24x3.6°=86.4 Tacos 8 0.16 16% 16x3.6°=57.6 Pozole 6 0.12 12% 12x3.6°=43.2 Pizza 5 0.1 10% 10x3.6°=36 Spagetti 3 0.06 6% 6x3.6°=21.6 Tortas 2 0.04 4% 4x3.6°=14.4 TOTAL 50 1.00 100% 360° Free Powerpoint Templates Page 22
  • 23.
  • 24.
    COLOR FAVORITO FREC. ABS. FREC. REL. PORCENTAJE GRADOS Verde 4 0.08 8% 28.8° Rojo 9 0.18 18% 64.8° Azul 14 0.28 28% 100.8° Amarillo 3 0.06 6% 21.6° Morado 9 0.18 18% 64.8° Negro 2 0.04 4% 14.4° Rosa 7 0.14 14% 50.4° Blanco 2 0.04 4% 14.4° TOTAL 50 1.00 100% 360° Free Powerpoint Templates Page 24
  • 25.
  • 26.
    DEPORTE FAVORITO FREC. ABS. FREC. REL. PORCENTAJE GRADOS FUTBOL 20 0.4 40% 144 NATACIÓN 12 0.24 24% 86.4 BASKETBALL 5 0.1 10% 36 AJEDREZ 2 0.04 4% 14.4 VOLEYBALL 4 0.08 8% 28.8 BASEBALL 5 0.1 10% 36 Free Powerpoint Templates ARTES MARCIALES 2 0.04 Page 26 4% 14.4 TOTAL 50 1 100% 360°
  • 27.
  • 28.
    N° de zapato Frecuencia 3.5 4 4 8 4.5 2 5 8 5.5 1 6 6 6.5 4 7 4 3.5 4 4.5 5 5.5 6 6.5 7 7.5 8 8.5 9 9.5 7.5 3 8 4 8.5 2 MEDIA 5.97 9 3 MEDIANA 6 9.5 1 MODA 4Y5 DESVIACION ESTANDAR 1.74499284 Q1 4.5 Q3 7.5 Free Powerpoint Templates Page 28
  • 29.
  • 30.
  • 31.
  • 32.
    ¿Qué haces entu tiempo libre? Frec. Abs. Frec. Rel. Porcentaje Grados Deportes 13 0.26 26% 93.6° Leer 4 0.08 8% 28.8° Escuchar música 3 0.06 6% 21.6° Ver TV 7 0.14 1.40% 50.4° Salir con amigos 2 0.04 4% 14.4° Shopping 3 0.06 6% 21.6° Chat 8 0.16 16% 57.6° Yoga 1 0.02 2% 7.2° Estudiar 6 0.12 12% 43.2° Clases de ingles 3 0.06 6% 21.6° Total 50 1 100 360° Free Powerpoint Templates Page 32
  • 33.
  • 34.
    X FRECUENCIA 2 4 4 1 5 7 6 5 7 2 8 12 9 4 10 15 Total 50 1 2 3 4 5 6 7 8 9 10 MEDIA 7.46 MEDIANA 8 MODA 10 DESVIACION ESTANDAR 2.45 Q1 6 Q3 10 Free Powerpoint Templates Page 34
  • 35.
    Como es elalumno típico de 3-04 fue el objetivo a alcanzar en esta investigación la cual realizamos por medio de encuestas para la recolección de datos y luego su interpretación de los mismos datos por medio de graficas ya sea de pastel, barras o de caja. Los resultados fueron los siguientes… 1. Sexo – Femenino 1. Sexo – Femenino 2. Posesión de pareja- mas de la mitad no tiene pareja 2. Posesión de pareja- mas de la mitad no tiene pareja 3. Promedio= 9 yypreferencia (psicología)= 7.5 3. Promedio= 9 preferencia (psicología)= 7.5 4. Peso- moda= 60.5 4. Peso- moda= 60.5 5. Estatura = 1,65 5. Estatura = 1,65 6. Promedio general- moda= 9 6. Promedio general- moda= 9 7. # de integrantes de la familia- domino= 55 7. # de integrantes de la familia- domino= 8. Música Favorita= POP 8. Música Favorita= POP 9. Comida Favorita= SUSHI 9. Comida Favorita= SUSHI 10. Color Favorito= Azul 10. Color Favorito= Azul 11. Deporte= Futbol 11. Deporte= Futbol 12. # de calzado= 4 y 55 12. # de calzado= 4 y 13. Materia Favorita= Psicología 13. Materia Favorita= Psicología 14. Hobbie= Deporte 14. Hobbie= Deporte Free Powerpoint Templates Page 35 15. Gusto en Psicología= 88 15. Gusto en Psicología=

Notas del editor