
Recomendados
Más contenido relacionado
Destacado
Más de JonatanTd
Más de JonatanTd (20)
Último
Último (20)
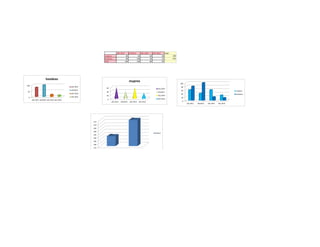
Evolución del empleo femenino y masculino entre 2012-2015
- 1. año 2012 año2013 año 2014 año 2015 total mujeres 60 40 60 30 190 hombres 80 100 20 15 215 total 140 140 80 45 0 20 40 60 80 100 año 2012 año2013 año 2014 año 2015 mujeres hombres 0 20 40 60 año 2012 año2013 año 2014 año 2015 mujeres año 2012 año2013 año 2014 año 2015 0 50 100 año 2012 año2013 año 2014 año 2015 hombres año 2012 año2013 año 2014 año 2015 175 180 185 190 195 200 205 210 215 mujeres hombres 190 215 Series1