SlideShare una empresa de Scribd logo
1 de 8
Descargar para leer sin conexión
VARIABLES
MACROECONÓMICAS
MACROECONOMIC VARIABLES
La economía peruana mantiene pi-
lares financieros moderadamente
sólidos: reservas de divisas, deuda
debidamente administrada, inflación
controlada, tipo de cambio en con-
cordancia con la política moneta-
ria interna; sin embargo, no es in-
mune al incierto marco internacio-
nal, donde una ralentización de la
economía y la caída de los precios
de los metales de exportación in-
ciden en la economía nacional. En
este contexto, la evolución
macroeconómica al cierre del pri-
mer trimestre registra comporta-
miento positivo y/o esTable .
La creación de riqueza expresada en
el PBI nacional alcanzó una tasa
acumulada de crecimiento de 4.8%;
en tanto, a nivel sectorial del PBI
Minero agregado del trimestre, ge-
neró una variación positiva de 5.2%.
Por su parte, los índices de inver-
sión respecto al PBI corresponden
al 28.2% (público 3.8% y privado
24.4%) en el trimestre.
Peru's economy maintains moderate and solid business pillars:
foreign currency reserves, properly managed debt, controlled in-
flation, and exchange rate in accordance with the domestic mo-
netary policy; however, it is still weak to the uncertain internatio-
nal frame, where a slowing down of the economy and a fall in the
prices of export metals affect the domestic economy. In this con-
text, the macroeconomics' development in the first quarter of the
year gives as a result a positive and sTable behavior.
The wealth creation expressed in the domestic GDP reached an
accumulated growth rate of 4.8%; while at sector level of the
added mining GDP of the quarter, it generated a positive varia-
tion of 5.2%. Meanwhile, the investment rates regarding to the
GDP corresponds to 28.2% (3.8% to public investment and 24.4%
to private investment).
The inflationary pressure and the expectation remain together
mainly by the food behavior that recorded an accumulated rate
of 1.44% although there are some risks regarding to the increase,
derived from the exchange depreciation. The monetary policy
conducted by the Banco Central de Reserva de Perú has conti-
nued reducing the legal bank reserves in local currency, trying to
counteract the liquidity absorption in local currency derived from
intervention in the foreign exchange market to avoid deprecia-
tion.
The result of trade balance recorded the effect of the exports de-
crease of traditional products (-19.4%) - mainly miners (-26%) and
hydrocarbons (-24.9%) - marked by the decline in imports value (-
2.7%) being the highest proportion of imported goods (78.83%)
the ones related to inputs and capital goods.
1
PRIMER TRIMESTRE
AVANCE ESTADÍSTICO
DEL SUBSECTOR MINERO
2014
1. Variables Macroeconómicas
Macroeconomic variables
2. Producción Minera
Mining production
3. Exportaciones Mineras
Mining exports
4. Cotizaciones
Prices
5. Empleo en Minería
Employment in mining
6. Inversión Minera
Mining investment
7. Cartera de Proyectos
Projects Portfolio
Año PBI PBI Minero Inflación Tipo Cambio Exportaciones Export. Min. Importaciones Bal. Comercial
Year GDP Mining GDP Inflation Exchange rate Exports Mining Exports Imports Commercial balance
2006 7.74% 1.10% 1.14% 3.27 23,830 14,735 14,844 8,986
2007 8.91% 1.70% 3.93% 3.13 28,094 17,439 19,591 8,503
2008 9.80% 7.28% 6.65% 2.93 31,019 18,101 28,449 2,569
2009 0.86% -1.41% 0.25% 3.01 26,962 16,382 21,011 5,951
2010 8.76% -4.79% 2.08% 2.83 35,565 21,723 28,815 6,749
2011 6.86% -3.17% 4.74% 2.75 46,268 27,361 36,967 9,302
2012 6.28% 2.19% 2.65% 2.64 46,228 26,308 41,113 5,115
2013 5.02% 2.17% 2.86% 2.70 41,826 23,030 42,191 -365
2014
Ene / Jan 4.00% 8.30% 3.07% 2.81 2,996 1,432 3,618 -622
Feb / Feb 5.40% 9.90% 3.78% 2.81 3,144 1,546 2,970 174
Mar / Mar 4.90% -1.70% 3.38% 2.81 2,878 1,353 3,368 -490
Tabla 01 / Table 01:
PRINCIPALES INDICADORES MACROECONÓMICOS / MAIN MACROECONOMICS INDICATORS
La presión inflacionaria y la expectati-
va permanecen ancladas, principal-
mente por el comportamiento de los
alimentos que registraron una tasa
acumulanda de 1.44% aunque exis-
ten algunos riesgos al alza, derivados
de las depreciaciones cambiarias. La
política monetaria efectuada por el
BCRP ha continuado reduciendo los
encajes bancarios en moneda local,
tratando de contrarrestar el drenaje
de liquidez en moneda local deriva-
do de la intervención en el mercado
de cambios para contener la depre-
ciación.
El saldo de la balanza comercial, re-
gistró el efecto de la disminución de
las exportaciones de productos tradi-
cionales (-19.4%) –principalmente
mineros (-26%) e hidrocarburos
(-24.9%)– acentuado por la disminu-
ción del valor de las importaciones
(-2.7%), siendo la mayor proporción
de bienes importados (78.83%) los
correspondientes a insumos y bienes
de capital
STATISTICAL REPORT OF THE MINING SUBSECTOR - 2014 FIRST QUARTER
Año /Year Cobre /Copper Oro/Gold Zinc/Zinc Plata/Silver Plomo/Lead Hierro/Iron Estaño/Tin
TMF/FMT gmF/Fine g. TMF/FMT KgF/FMT TMF/Fine kg. TMF/FMT TMF/FMT
2006 1,048,472 202,825,999 1,203,364 3,470,661 313,332 4,784,601 38,470
2007 1,190,274 170,235,864 1,444,361 3,501,462 329,165 5,103,597 39,019
2008 1,267,867 179,870,473 1,602,597 3,685,931 345,109 5,160,707 39,037
2009 1,276,249 183,994,692 1,512,931 3,922,708 302,459 4,418,768 37,503
2010 1,247,184 164,084,389 1,470,450 3,640,465 261,990 6,042,644 33,848
2011 1,235,345 166,186,717 1,256,383 3,418,862 230,199 7,010,938 28,882
2012 1,298,744 161,763,763 1,281,230 3,480,641 249,183 6,684,539 26,105
2013 1,375,641 151,486,072 1,351,273 3,674,283 266,472 6,680,659 23,668
2014 340,555 33,252,974 291,045 845,055 63,232 2,029,349 5,775
Ene / Jan 111,855 11,089,193 100,885 274,725 21,995 644,218 2,015
Ene / Feb 112,895 11,097,358 95,202 280,682 19,442 617,023 1,815
Ene / Mar 115,805 11,066,423 94,958 289,648 21,795 768,108 1,945
Tabla 02 / Table 02:
VOLUMEN DE LA PRODUCCIÓN MINERO METÁLICA, POR PRINCIPALES METALES
MINING METALLIC PRODUCTION VOLUME, BY MAIN METALS.
Principales productos:
La evolución en la producción nacional de cobre se mantiene favora-
ble en 16.53% en el primer trimestre del año. Las empresas que me-
jor desempeño han experimentado son: Minera Milpo, que tuvo un
incremento de 31.06% en su producción; Sociedad Minera El Brocal
S.A.A. (150.65%), y Compañía Minera Antamina S.A. (27.48%).
En tanto, la producción argentífera registró un crecimiento de 1.01%,
debido principalmente al aumento obtenido en Compañía Minera Milpo
(27.59%), como resultado de la ampliación en su planta Cerro Lindo
y una mejora en la extracción de 70.44% en su unidad “Milpo N° 1”;
así como al incremento registrado en Volcan Compañía Minera S.A.A.
(9.30%), en sus unidades mineras "Carahuacra" y "Colombia".
En relación al zinc, en el trimestre se observó una caída de 12.07%,
debido a que en la dinámica empresarial nacional, se priorizó la ren-
tabilidad generada por las actividades de explotación de cobre, des-
plazando las operaciones extractivas de zinc. Así, Compañía Minera
Antamina registró una caída del 40.31% en su producción en este
metal. Por otro lado, Compañía San Ignacio de Morococha S.A.A. y
Trevali Perú S.A.C. registraron incrementos.
Como consecuencia de la caída en la producción de las principales
empresas auríferas del sector, se observó una descenso de 7.71%
en la producción de oro a nivel nacional en este periodo. De este
modo, Mra. Yanacocha y Mra. Barrick Misquichilca registraron una
disminución del 26.43% y 17.23% respectivamente. Por otro lado,
destaca el impetuoso incremento de la producción en este periodo,
de la empresa La Arena S.A. (54%), en su unidad minera del mismo
nombre
PRODUCCIÓN
METÁLICA
MINING PRODUCTION
2
Main products:
The progression of the copper domestic production re-
mains favorable with 16.53% in the first quarter of the
year. The enterprises which had a better performance
are: Minera Milpo, with an increase of 31.06% of its pro-
duction, Sociedad Minera El Brocal S.A.A. (150.65%) and
Compañía Minera Antamina S.A. (27.48%).
Meanwhile, the silver production recorded a growth of
1.01% mainly due to the increase achieved in Compañía
Minera Milpo (27.59%), as a result of the expansion of
the Cerro Lindo plant, and an increase of 70.44% in the
"Milpo Nº1" unit, also considering the registered increase
in Volcan Compañía Minera S.A.A. (9.30%), in the "Ca-
rahuacra" and "Colombia" mining units.
During the quarter period of the year, the zinc produc-
tion faced a decrease of 12.07%, due to the profitability
generated by copper exploitation, placing it above the
zinc extraction operations. The production of the Com-
pañía Minera Antamina also decreased 40.31% regar-
ding to this metal. By the other hand, the Compañía San
Ignacio de Morococha S.A.A and Trevali Perú S.A.C re-
corded a notable growth of their production.
As a consequence of the production decrease of the prin-
ciple gold enterprises of the sector, there was a fall of
7.71% of the gold production nationwide in this period.
Then, Minera Yanacocha and Minera Barrick Misquichil-
ca faced a decrease of 26.43% and 17.23% respectively.
By the other hand, the rapid growing of La Arena enter-
prise production (54%) stands out in this period.
EXPORTACIONES
MINERAS
MINING EXPORTS
3
Tabla 03 / Table 03:
EXPORTACIONES MINERAS POR PRINCIPALES PRODUCTOS /
MINING EXPORT BY MAIN PRODUCTS
EXPORTACIONES/Exports UNIDAD//Unit 2009 2010 2011 2012 2013 ENE-MAR 2013 2014 Var. %
Cobre Valor (US$MM) 5,934 8,870 10,711 10,694 9,809 1,986 2,397 1,986 -17.15%
Copper Cantidad (Miles Tm) 1,246 1,254 1,257 1,401 1,401 295 314 295 -6.15%
Precio* (Ctvs US$/Lb.) 214 321 387 346 3,834 306 346 306 -11.72%
Oro Valor (US$MM) 6,805 7,756 10,104 9,542 7,846 1,182 2,229 1,182 -46.97%
Gold Cantidad (Miles Oz. Tr.) 6,987 6,346 6,415 5,709 5,555 915 1,369 915 -33.15%
Precio* (US$/Oz Tr.) 974 1,225 1,570 1,670 16,932 1,291 1,628 1,291 -20.69%
Zinc Valor (US$MM) 1,233 1,691 1,522 1,342 1,412 357 351 357 1.71%
Zinc Cantidad (Miles Tm.) 1,373 1,310 1,007 1,010 1,078 264 250 264 5.93%
Precio* (Ctvs US$/Lb.) 39 59 69 60 722 61 64 61 -4.08%
Plata Valor (US$MM) 214 118 219 210 479 136 80 136 70.00%
Silver Cantidad (Millones Oz. Tr.) 16 6 7 7 21 7 2.7 7 148.15%
Precio* (US$/Oz. Tr.) 14 19 34 30 287 20 30 20 -32.23%
Plomo Valor (US$MM) 1,116 1,579 2,424 2,503 1,749 282 343 282 -17.78%
Lead Cantidad (Miles Tm.) 681 770 986 1,140 847 139 144 139 -3.62%
Precio* (Ctvs US$/Lb.) 72 92 113 100 1,141 92 108 92 -14.62%
Estaño Valor (US$MM) 479 663 755 541 496 92 135 92 -31.85%
Tin Cantidad (Miles Tm.) 38 34 29 26 22 4 6 4 -26.79%
Precio* (Ctvs US$/Lb.) 553 902 1,183 948 12,096 1,016 1,093 1,016 -7.01%
Hierro Valor (US$MM) 298 523 1,023 856 857 216 240 216 -10.00%
Iron Cantidad (Miles Tm.) 7 8 9 10 10 3 2.7 3 11.11%
Precio* (US$/Tm) 44 68 113 88 989 71 91 71 -21.33%
Molibdeno Valor (US$MM) 276 492 571 431 358 76 69 76 10.14%
Molybdenum Cantidad (Miles Tm.) 12 17 19 18 18 4 3 4 28.13%
Precio* (Ctvs US$/Lb.) 1,021 1,337 1,342 1,091 10,719 845 968 845 -12.68%
Otros / Other Valor (US$MM) 28 29 31 22 23 3 2 3 55.95%
TOTAL US$ MM 16,382 21,723 27,361 26,142 23,030 4,330 5,846 4,330 -25.93%
Exportaciones mineras:
En el trimestre, el volumen de exportación del sector minero representó
el 70% del total de productos tradicionales y el 48.2% de la exportación
total; siendo el cobre y el oro, los productos más exportados, sin embar-
go, los menores volúmenes embarcados incidieron en el resultado del
sector minero, disminuyendo el resultado general en 23.5% respecto al
valor reportado en el trimestre del año anterior.
En enero, el volumen de cobre retrocedió en 17,4% debido a la menor
demanda del mercado chileno (-89,4%); asimismo, no reporto exporta-
ción hacia Alemania a diferencia de enero de 2013. De igual forma; Ca-
nadá, Suiza y Estados Unidos de América reportaron disminución en los
volúmenes de compra del oro.
En febrero, el volumen exportado de oro retrocedió en 52,6% debido a la
menor demanda del mercado suizo, canadiense y norteamericano. Mien-
tras que, las exportaciones de cobre reportaron un incremento de 29,3%,
por las mayores compras de China y Alemania.
Finalmente; en marzo, el principal mercado de destino del cobre peruano
fue China pero disminuyó sus compras en 25,5%; por su parte, los en-
víos de oro se redujeron en 44,3%; ante la menor demanda del mercado
suizo, canadiense y estadounidense
During the quarter period of the year, the export volume
of the mining sector represented 70% of the total domes-
tic products, and 48.2% of the total export; copper and
gold were the most exported products, nevertheless, the
lowest products volume exported had an impact on the
mining sector result, causing a decrease of 23.5% of the
general result regarding to the reported value in the last
year quarter.
In January, the copper volume decline 17.4% due to the
lowest demand of the Chilean market (89.4%); also, the-
re was not export to Germany unlike January 2013.
Likewise, Canada, Switzerland and United States face a
decrease in the gold sale volume.
In February, the copper volume decreased 52.6% due to
the low demand of the Switzerland, Canadian and North
American market. Meanwhile, the copper exportations
report an increase of 29.3% caused by the great purcha-
se quantity of China and Germany.
Finally, in March, the principle market destination of Pe-
ruvian copper was China but the sales reduced 25.5%; on
the other hand, the gold exports decreased 44.3%; in
front of the Switzerland, Canada and United States mar-
ket.
COTIZACIÓN DE
PRINCIPALES METALES
MAIN METALS PRICES
4
Año/Year Cobre/Copper Oro/Gold Zinc/Zinc Plata/Silver Plomo/Lead Estaño/Tin
Ctvs. US$/lb. US$/Oz. Tr. Ctvs. US$/lb. US$/Oz. Tr. Ctvs. US$/lb. Ctvs. US$/lb.
2006 304.91 604.58 148.56 11.57 58.50 398.29
2007 322.93 697.41 147.07 13.42 117.03 659.47
2008 315.51 872.72 85.04 15.01 94.83 839.60
2009 233.52 973.62 75.05 14.68 77.91 615.83
2010 342.28 1,225.29 98.18 20.19 97.61 926.63
2011 400.20 1,569.53 99.50 35.17 108.97 1,183.96
2012 360.55 1,669.87 88.35 31.17 93.54 958.08
2013 332.31 1,411.00 86.65 23.86 97.17 1,012.24
2014 319.25 1,293.95 92.05 20.48 95.49 1,027.83
Ene / Jan 330.89 1,244.80 92.46 19.87 97.47 1,001.15
Feb / Feb 324.42 1,300.98 92.32 20.85 95.73 1,034.61
Mar / Mar 302.45 1,336.08 91.37 20.72 93.27 1,047.72
Tabla 04 / Table 04:
COTIZACIONES, POR PRINCIPALES METALES /
PRICES, BY MAIN METALS
Oro:
En enero, el precio promedio del oro fue de
US$/oz.tr. 1,244.8 mayor en 1.8% respecto
del mes anterior. Esta subida fue alentada
por la caída de los índices bursátiles inter-
nacionales que incrementaron la demanda
por el metal precioso como activo de refu-
gio, y en medio de una mayor compra pro-
veniente de China antes del feriado por el
Año Nuevo Lunar chino. En febrero, el oro
cotizó en US$/oz.tr. 1,301; mayor en 4.5%
respecto del mes anterior. Este comporta-
miento al alza se explicó por la depreciación
del dólar frente al euro y por la mayor de-
manda física para joyería, monedas y ba-
rras de oro a inicios de mes, principalmente
de China e India. Finalmente, el precio pro-
mediodeloroenmarzofueUS$/oz.tr.1,336.1;
mayoren2.7% respectodelmesanterior.Este
comportamiento estuvo sustentado en la de-
preciación del dólar frente al euro y en la ma-
yor demanda como activo de refugio por la
crisis rusa-ucraniana.
Cobre:
Durante enero, el precio del cobre promedió
US$/lb. 3.31, aumentando 1.3% respecto de
diciembre. El aumento se sustentó en las
señales de poca disponibilidad de cobre en
los depósitos de la Bolsa de Metales de Lon-
dres ante demoras de suministros por las
huelgas portuarias en Chile.
El precio del cobre promedió US$/lb. 3.24
en febrero, menor en 2.0% respecto de ene-
ro. El precio de cobre se redujo por preocu-
paciones sobre la demanda de China, por el
fuerte incremento de la producción de
Glencore Xstrata en sus minas de África y
Chile, así como por las mayores existencias
de cobre en China.
En marzo, el precio del cobre promedió US$/
lb. 3.02; menor en 6.8% respecto de febre-
ro. La reducción se produjo por los mayo-
res temores de desaceleración de China (tras
difusión de datos negativos de comercio y
crédito), y por el aumento de los inventarios
de cobre en dicho país.
Zinc:
La cotización promedio en enero fue US$/
lb. 0.93; mayor en 3.3% respecto del mes
previo. Este incremento reflejó el dato del
reporte del Grupo Internacional de Estudios
del Zinc y Plomo (ILZSG) que señaló un dé-
ficit en el mercado mundial de zinc refina-
do entre enero y noviembre de 2013; así
como de ajustados suministros a corto pla-
zo.
En febrero fue US$/lb. 0.92; disminuyendo
0.1% respecto del mes previo. Cayó por ex-
pectativas de menor demanda ante débiles
datos económicos de Estados Unidos y Chi-
na, aunque la escasez a corto plazo -reflejado
en los menores inventarios- atenuó la caída.
Finalmente, la cotización promedio del zinc
en marzo fue US$/lb. 0.91, disminuyendo
1,0% respecto del mes previo. Esta caída
reflejó el aumento de existencias en las prin-
cipales bolsas de metales del mundo y los
temores de que la desaceleración económi-
ca de China afecte la demanda del metal
Gold.- In January, the average price of gold
was US$/oz.tr.1,244.8, resulting in 1.8%
more than the last month. This rising was
encourage by the fall of the international
stock index that incremented the demand
for the precious metal as a haven asset,
and, in the middle of a major purchase
from China before the Lunar New Year
holiday. In February, the gold price was
US$/oz.tr.1,301, resulting in 4.5% more
than the last month. This increase is due
to the dollar depreciation with respect to
the euro and the greater physical demand
for jewelry, coins and gold barriers in ear-
ly February, mainly in China and India. Fi-
nally, the average gold price in March was
US$/oz.tr.1,336.1, resulting in 2.7% more
in relation to last month. This tendency
was supported by the dollar depreciation
with respect to the euro and the greater
demand as a haven asset by the Russian-
Ukrainian crisis.
Copper.- During January, the copper price
average from US$/lb.3,31 growing 1.3% in
relation to December. The growing was
supported by the signs of the limited cop-
per availability in the deposits in the Lon-
don Metal Exchange regarding to the su-
pply delay due to the port strikes in Chile.
In February, the copper price average from
US$/lb.3.24, decreasing 2.0% with respect
of January. The copper price reduced due
to the worry concerning the China de-
mand, because of the stronger production
increase of Glencore Xstrata and its Africa
and Chile mines, also because of the grea-
ter copper existence in China.
In March, the copper price average from
US$/lb.3,02 decreasing 6.8% with respect
of February. This decrease was caused by
the biggest fear of China desaceleration
(Continue on next page)
EMPLEO EN MINERÍA
MINING EMPLOYMENT5
Año Contratista Compañia Total
Year Contractor Company Total
2006 40,633 67,860 108,493
2007 54,613 80,368 134,981
2008 60,783 66,243 127,026
2009 58,987 67,096 126,083
2010 67,575 97,956 165,531
2011 73,257 102,073 175,330
2012 85,470 128,521 213,991
2013 67,950 140,433 208,383
2014 63,116 122,937 186,053
Ene / Jan 62,579 123,627 186,206
Feb / Feb 65,101 125,788 190,889
Mar / Mar 61,669 119,395 181,064
Tabla 05 / Table 05:
EMPLEO DIRECTO EN MINERÍA, PROMEDIO TRABAJADORES /
DIRECT EMPLOYMENT IN MINING, AVERAGE NUMBER OF WORKERS
Empleo directo:
Con relación a la actividad minera, un pro-
medio de 186,053 empleos directos han sido
reportados por los titulares de la actividad
minera durante el primer trimestre del año
2014.
En tanto que en las regiones; durante el pri-
mer trimestre del año, 5 regiones concentran
la mayor cantidad de empleos generados por
la actividad minera.
En primer lugar se encuentra la región
Arequipa, con un total de 26,659 empleos
directos, representando el 14.33% del pro-
medio total; en segundo lugar, se ubica la re-
gión Junín con 19,833 empleos (10.66 %);
luego siguen: La Libertad con 16,588 em-
pleos; Pasco con 16,444 empleos; y Lima
con 13,518 empleos (8.92%, 8.84%, 7.27%
del promedio total, respectivamente)
(after the trade and credit negative data
broadcasting), and by the increase of the
copper stock in that country.
Zinc.- In January, the average cost of zinc
was US$/lb.0,93 growing 3.3% with res-
pect of the last month. This increase show
the report information from the Interna-
tional Lean and Zinc Study Group which
reported a deficit of the world refined zinc
market between January and November
of 2013; as the supply small quantity in
short term.
In February, the zinc production was US$/
lb. 0.92; having a decrease of 0.1% com-
paring to last month. The decrease was
caused by the lower demand expectatio-
ns of weak economic information from
United States and Chile, although the
short term scarcity showed in the mi-
nor inventories, alleviate the falling.
Finally, the average zinc price in Mar-
ch was US$/lb. 0.91, having a decrea-
se of 1.0% comparing to last month.
The decrease showed the existence
increase in the main metal exchanges
in the world and the fears that the eco-
nomic deceleration of China affects
the metal demand.
Regarding to mining activity, an average
of 186,053 direct employments has been
reported by the mining activity headlines
during the first quarter of 2014.
During this period of the year, 5 regions
concentrate the major employment quan-
tity generated by the mining activity.
In first place, there is Arequipa with a
total of 26,659 direct employments, re-
presenting the 14,33% of the total ave-
rage; in second place, there is Junín with
19,833 employments (10.66%), La Liber-
tad with 16,588 employments (8.92%);
Pasco with 16,444 employments
(8.84%),and finally Lima with 13,518
employments (7.27% of the total avera-
ge).
INVERSIÓN MINERA
MINING INVESTMENT6
Año Eq. de Planta. Eq. Minero Exploración Explotación Infraestructura Otros Preparación Total
Year Plant. Eq.. Mining Eq. Exploration Exploitation Infrastructure Others Preparation Total
2006 63,538,746 124,092,578 102,387,499 340,970,408 640,626,630 273,461,734 64,837,125 1,609,914,721
2007 63,768,994 125,551,262 136,592,095 338,016,660 336,788,377 197,918,361 50,179,973 1,248,815,722
2008 141,038,944 176,688,012 167,839,351 440,246,645 321,482,441 328,783,686 131,980,228 1,708,059,306
2009 319,825,374 499,659,327 393,534,656 531,388,349 376,380,329 504,747,514 196,060,821 2,821,596,371
2010 416,011,993 518,078,947 615,815,227 737,890,193 827,591,969 443,780,328 510,276,007 4,069,444,664
2011 1,124,690,664 776,137,869 865,423,284 869,691,352 1,406,853,178 1,412,347,788 788,223,911 7,243,368,046
2012 1,139,598,256 525,252,803 905,401,645 1,005,399,266 1,797,081,533 2,491,858,829 638,740,607 8,503,332,940
2013 1,404,301,909 778,849,649 774,008,005 1,071,915,417 1,709,625,770 3,629,234,450 351,088,998 9,719,024,198
2014 186,498,762 125,710,928 143,923,382 238,163,428 294,924,078 921,157,620 64,783,016 1,975,161,215
Ene / Jan 51,565,155 34,224,548 39,198,206 72,397,041 79,670,285 267,535,375 15,587,069 560,177,678
Feb / Feb 57,187,441 44,193,000 42,658,925 79,558,556 111,242,375 323,767,963 18,899,606 677,507,866
Mar / Mar 77,746,166 47,293,380 62,066,250 86,207,832 104,011,418 329,854,283 30,296,342 737,475,672
Tabla 06 / Table 06:
INVERSIONES MINERAS EN US$, SEGÚN RUBRO /
MINING INVESTMENTS IN US$, ACCORDING TO EACH FIELD
Análisis:
La inversión minera en el pri-
mer trimestre del 2014, ascen-
dió a US$ 1,975 millones; va-
lor superior en 1.8% a la inver-
sión ejecutada en el mismo pe-
riodo del año 2013, que fue de
US$ 1,940 millones.
Según el tipo de inversión re-
gistrada en este periodo, el cre-
cimiento de las inversiones se
dió en el rubro infraestructura
(12.2%) y Otros (24.2%). En
contraposición, se apreció una
reducción en las inversiones
destinadas a Equipamiento de
Planta de Beneficio (-24.3%),
explicado por la menor inver-
sión reportada por Minera
Chinalco, que inició operacio-
nes en el presente año.
RUBROS 2013 2014 Variacion %
EQ. DE PTA DE BENEFICIO 246,286,434 186,498,762 -24.28%
EQ. MINERO 150,688,254 125,710,928 -16.58%
EXPLORACIÓN 185,370,235 143,923,382 -22.36%
EXPLOTACIÓN 263,563,456 238,163,428 -9.64%
INFRAESTRUCTURA 262,892,859 294,924,078 12.18%
OTROS 741,905,443 921,157,620 24.16%
PREPARACIÓN 89,506,707 64,783,016 -27.62%
TOTAL GENERAL 1,940,213,388 1,975,161,215 1.80%
During the first quarter of 2014, the mining investment
increased to US$ 1,975 millions, an exceeded value in 1.8%
to the investment of US$ 1,940 million made in the same
period of 2013,
According to the investment type registered during this
period, the investments growth was mainly observed in
the infrastructure field (12.2%) and Others (24.2%). On
the other hand, there was a decrease in the investments
destined to the Equipment of the Beneficial plant (-24.3%)
explained by the minor investment reported by Minera
Chinalco which began operations this year.
During the first quarter of the year, 426 companies re-
ported investments made in this period. Sociedad Mine-
ra Cerro Verde (US$ 440 million), Xstrata Las Bambas (US$
352 millions) and Hudbay Perú S.A.C. (US$ 175 millions)
are the companies that stand out of this group.
Meanwhile at regional level, Arequipa stands out as lea-
der of investments made in its jurisdiction where it re-
ported US$ 495 millions followed by Apurímac (US$ 358
millions), Cusco (US$ 139 millions), Junín (US$ 139 millio-
ns) and La Libertad (US$ 135 millions) among others.
De las 426 empresas que re-
portaron inversiones ejecuta-
das en el primer trimestre del
año, destacan las realizadas
por Sociedad Minera Cerro
Verde S.A.A. (US$ 440 millo-
nes), Xstrata Las Bambas
(US$ 352 millones) y Hudbay
Perú S.A.C. (US$ 175 millo-
nes).
En tanto, a nivel regional,
Arequipa destaca como líder
de inversiones ejecutadas en
su jurisdicción al registrar US$
495 millones seguida por
Apurímac (US$ 358 millones),
Cusco (US$ 290 millones),
Junín (US$ 139 millones) y La
Libertad (US$ 135 millones,
entre otras
CARTERA PROYECTOS MINEROS
ESTIMATED MINING PROJECTS PORTFOLIO7
AMPLIACIONES / Expansion
COMPAÑIA MINERA MISKI MAYO S.R.L. Ampliación Bayovar PIURA, SECHURA, SECHURA Fosfatos 520
SOCIEDAD MINERA CERRO VERDE S.A.A. Ampliación Cerro Verde AREQUIPA, AREQUIPA, YARABAMBA Cu 4,600
SOCIEDAD MINERA EL BROCAL S.A.A. Ampliación Colquijirca PASCO, PASCO, TINYAHUARCO Polimetálico 432
SOUTHERN PERU COPPER CORP. Ampliación Fundición MOQUEGUA, ILO, PACOCHA Cu Por definir
SHOUGANG HIERRO PERU S.A.A. Ampliación Marcona ICA, NAZCA, MARCONA Fe 1,500
SOUTHERN PERU COPPER CORP. Ampl. Refinería de Ilo MOQUEGUA, ILO, PACOCHA Cu Por definir
SOUTHERN PERU COPPER CORP. Ampliación Toquepala TACNA, JORGE BASADRE, ILABAYA Cu 1,050
MINERA CHINALCO PERÚ S.A. Ampliacion Toromocho JUNIN, YAULI, MOROCOCHA Cu 1,320
CON E.I.A. APROBADO / With E.I.A. Approved
ANABI S.A.C. Anama APURIMAC, ANTABAMBA, HUAQUIRCA Au 40
HUDBAY PERU S.A.C. Constancia CUSCO, CHUMBIVILCAS, CHAMACA Y LIVITACA Cu 1,790
BEAR CREEK MINING COMPANY Corani PUNO, CARABAYA, CORANI Ag 750
COMPAÑIA MINERA ARES S.A.C. Crespo CUSCO, CHUMBIVILCAS, SANTO TOMAS Au - Ag 110
MINERA SHOUXIN PERU S.A. Explotacion de relaves ICA, NAZCA, MARCONA Cu, Fe, Zn 239
MINERA SUYAMARCA S.A.C. Inmaculada AYACUCHO, PARINACOCHAS - OYOLO Au - Ag 370
INVICTA MINING CORP S.A.C. Invicta LIMA, HUAURA, LEONCIO PRADO Polimetálico 93
XSTRATA LAS BAMBAS S.A. Las Bambas APURIMAC, COTABAMBAS, CHALHUAHUACHO Cu 5,895
MINERA YANACOCHA S.R.L. Minas Conga CAJAMARCA, CAJAMARCA, BAÑOS DEL INCA Cu, Au 4,800
COMPAÑIA MINERA KURI KULLU S.A. Ollachea PUNO, CARABAYA, OLLACHEA Au 170
FOSFATOS DEL PACIFICO S.A. Fosfatos PIURA, SECHURA, SECHURA Fosfatos 500
ANGLO AMERICAN QUELLAVECO S.A. Quellaveco MOQUEGUA, MARISCAL NIETO, TORATA Cu 3,300
RELIANT VENTURES S.A.C. San Luis ANCASH, YUNGAY, SHUPLUY Au y Ag por definir
MINERA SULLIDEN SHAHUINDO S.A.C. Shahuindo CAJAMARCA, CAJAMARCA, CACHACHI Au 208
MINERA CHINALCO PERÚ S.A. Toromocho JUNIN, YAULI, MOROCOCHA Cu 3,500
CON EIA PRESENTADO / With Environmental Assessments under Evaluation
COMPAÑIA MINERA MILPO S.A.A. Pukaqaqa HUANCAVELICA, HUANCAVELICA, HUANDO Cu-Mo 630
BEAR CREEK MINING COMPANY Santa Ana PUNO, CHUCUITO, HUACULLANI Ag 71
CÍA DE MINAS BUENAVENTURA S.A.A. Tambomayo AREQUIPA, CAYLLOMA, TAPAY Au, Ag 130
SOUTHERN PERU COPPER CORP. Tia Maria AREQUIPA, ISLAY, COCACHACRA Cu 1,000
EN EXPLORACIÓN / Exploration
EXPLORACIONES COLLASUYO S.A.C. Accha CUSCO, PARURO, ACCHA Zn, Pb 346
ANABI S.A.C. Anubia APURIMAC, ABANCAY, CURAHUASI Cu 90
CAÑARIACO COPPER PERU S.A. Cañariaco LAMBAYEQUE, FERREÑAFE, CAÑARIS Cu 1,599
JUNEFIELD GROUP S.A. Cercana AREQUIPA, AREQUIPA, YARABAMBA Cu
MINERA CUERVO S.A.C. Cerro Ccopane CUSCO, PARURO, OMACHA Fe -
CANTERAS DEL HALLAZGO S.A.C. Chucapaca MOQUEGUA, GRAL.SANCHEZ CERRO, ICHUÑA Au 1,200
MINSUR S.A. Expl. Bofedal II PUNO, MELGAR, ANTAUTA Sn 165
MANTARO PERU S.A.C. Fosfatos Mantaro JUNIN, CONCEPCION, ACO Fosfatos 850
LUMINA COPPER S.A.C. Galeno CAJAMARCA, CELENDIN, CELENDIN Cu, Mo, Au, Ag 2,500
MINERA ANTARES PERU SAC Haquira APURIMAC, COTABAMBAS, CHALHUAHUACHO Cu-Mo 2,800
APURIMAC FERRUM S.A. Hierro Apurimac APURIMAC, ANDAHUAYLAS, ANDAHUAYLAS Fe 2,300
COMPAÑIA MINERA MILPO S.A.A. Hilarión ANCASH, BOLOGNESI, HUALLANCA Zn 470
RIO TINTO MINERA PERU LIMITADA SAC La Granja CAJAMARCA, CHOTA, QUEROCOTO Cu 1,000
HAMPTON MINING PERU SAC Los Calatos MOQUEGUA, MARISCAL NIETO, MOQUEGUA Cu-Mo 1,320
SOUTHERN PERU COPPER CORP. Los Chancas APURIMAC, AYMARAES, POCOHUANCA Cu 1,560
COMPAÑIA MINERA MILPO S.A.A. Magistral ANCASH, PALLASCA, CONCHUCOS Cu 750
MARCOBRE S.A.C. Marcobre (Mina Justa) ICA, NAZCA, SAN JUAN DE MARCONA Cu 744
ANGLO AMERICAN MICHIQUILLAY S.A. Michiquillay CAJAMARCA, CAJAMARCA, LA ENCAÑADA Cu 700
JINZHAO MINING PERU S.A. Pampa de Pongo AREQUIPA, CARAVELI, BELLA UNION Fe 3,280
COMPAÑIA MINERA QUECHUA S.A. Quechua CUSCO, ESPINAR, ESPINAR Cu 490
COMPAÑIA MINERA CENTAURO S.A. Quicay II PASCO, PASCO, SIMON BOLIVAR Au, Cu 3,000
RIO BLANCO COPPER S.A. Río Blanco PIURA, HUANCABAMBA, Cu 1,500
COMPAÑIA MINERA VICHAYCOCHA S.A.C. Rondoni HUANUCO, AMBO, CAYMA Cu 350
AMERICAS POTASH PERU S.A. Salmueras de Sechura PIURA, SECHURA, SECHURA Potasio 125
TOTAL US$ MM 61,279
EMPRESA PROYECTO REGION/PROVINCIA/DISTRITO MINERAL INVERSION US$ MM
COMPANY PROJECT REGION / PROVINCE / DISTRICT MINERAL INVESTMENT
Tabla 07 / Table 07:
CARTERA PROYECTOS MINEROS / ESTIMATED MINING PROJECTS PORTFOLIO
PUERTO
CHUCAPACA
CERRO VERDE
CERCANA
ZAFRANAL TAMBOMAYOPAMPA DE PONGO
CORANI
QUECHUACONSTANCIA
CRESPO
CCOPANE
HAQUIRA
INMACULADA
LOS CHANCAS
APURIMAC F.
MARCONA
JUSTA
PUKAQAQA
RONDONI
QUICAY II
TOROMOCHO
FOSF. MANTARO
INVICTA
COLQUIJIRCA
HILARION
SAN LUIS
MAGISTRAL
SHAHUINDO
CONGA
GALENO
MICHIQUILLAY
LA GRANJA
CAÑARIACO
BAYOVAR
S. SECHURA
RIO BLANCO
P. FOSFATOS
LOS CALATOS
OLLACHEA
SANTA ANA
ACCHA
ANUBIA
Tacna
Moquegua
Arequipa
Puno
Cusco
Madre de Dios
Apurimac
Ayacucho
Huancavelica
Ica
Ucayali
Junín
Pasco
Huánuco
Lima
Ancash
San Martín
Loreto
AmazonasCajamarca
Piura
Lambayeque
La Libertad
Tumbes
SHOUXIN
CARTERA PROYECTOS MINEROS
ESTIMATED MINING PROJECTS PORTFOLIO

Más contenido relacionado

La actualidad más candente

Documento Informe de coyuntura económica Noviembre 2016
Documento Informe de coyuntura económica Noviembre 2016Documento Informe de coyuntura económica Noviembre 2016
Documento Informe de coyuntura económica Noviembre 2016FUSADES
 
Balanza comercial 2011
Balanza comercial 2011Balanza comercial 2011
Balanza comercial 2011Mary Mata
 
CESCE informe_sectorial_COMPLETO_2016
CESCE informe_sectorial_COMPLETO_2016CESCE informe_sectorial_COMPLETO_2016
CESCE informe_sectorial_COMPLETO_2016Jaime Cubillo Fleming
 
Informe de Actividad Regional al Primer Trimestre de 2016
Informe de Actividad Regional al Primer Trimestre de 2016Informe de Actividad Regional al Primer Trimestre de 2016
Informe de Actividad Regional al Primer Trimestre de 2016Eduardo Nelson German
 
Reporte industrias extractivas Bolivia
Reporte industrias extractivas BoliviaReporte industrias extractivas Bolivia
Reporte industrias extractivas BoliviaFundacion Jubileo
 
Realidad EconóMica.Ppt 5 Ta Sema
Realidad EconóMica.Ppt 5 Ta SemaRealidad EconóMica.Ppt 5 Ta Sema
Realidad EconóMica.Ppt 5 Ta Semaguest27c580
 
27 octubre 2014-balanza_comercial_a_septeibmre
27 octubre 2014-balanza_comercial_a_septeibmre27 octubre 2014-balanza_comercial_a_septeibmre
27 octubre 2014-balanza_comercial_a_septeibmreArenaPublica
 
Así está la economía noviembre 2015 Circulo de empresarios
Así está la economía noviembre 2015 Circulo de empresariosAsí está la economía noviembre 2015 Circulo de empresarios
Así está la economía noviembre 2015 Circulo de empresariosCírculo de Empresarios
 
Notiplastic enero 2015
Notiplastic enero 2015Notiplastic enero 2015
Notiplastic enero 2015avipla
 
Atrayendo inversiones
Atrayendo inversionesAtrayendo inversiones
Atrayendo inversionesalbertoyon
 
Crisis Económica en el Perú: Breve Balance y Perspectivas. 2009
Crisis Económica en el Perú: Breve Balance y Perspectivas. 2009Crisis Económica en el Perú: Breve Balance y Perspectivas. 2009
Crisis Económica en el Perú: Breve Balance y Perspectivas. 2009Larcery Díaz Barrantes
 
INEI - Informe produccion nacional 2014
INEI - Informe produccion nacional 2014INEI - Informe produccion nacional 2014
INEI - Informe produccion nacional 2014Hernani Larrea
 

La actualidad más candente (16)

Documento Informe de coyuntura económica Noviembre 2016
Documento Informe de coyuntura económica Noviembre 2016Documento Informe de coyuntura económica Noviembre 2016
Documento Informe de coyuntura económica Noviembre 2016
 
Balanza comercial 2011
Balanza comercial 2011Balanza comercial 2011
Balanza comercial 2011
 
CESCE informe_sectorial_COMPLETO_2016
CESCE informe_sectorial_COMPLETO_2016CESCE informe_sectorial_COMPLETO_2016
CESCE informe_sectorial_COMPLETO_2016
 
Informe de Actividad Regional al Primer Trimestre de 2016
Informe de Actividad Regional al Primer Trimestre de 2016Informe de Actividad Regional al Primer Trimestre de 2016
Informe de Actividad Regional al Primer Trimestre de 2016
 
Reporte industrias extractivas Bolivia
Reporte industrias extractivas BoliviaReporte industrias extractivas Bolivia
Reporte industrias extractivas Bolivia
 
PIB 3er trimestre 2015
PIB 3er trimestre 2015PIB 3er trimestre 2015
PIB 3er trimestre 2015
 
Realidad EconóMica.Ppt 5 Ta Sema
Realidad EconóMica.Ppt 5 Ta SemaRealidad EconóMica.Ppt 5 Ta Sema
Realidad EconóMica.Ppt 5 Ta Sema
 
Realidad economica
Realidad economicaRealidad economica
Realidad economica
 
27 octubre 2014-balanza_comercial_a_septeibmre
27 octubre 2014-balanza_comercial_a_septeibmre27 octubre 2014-balanza_comercial_a_septeibmre
27 octubre 2014-balanza_comercial_a_septeibmre
 
Así está la economía noviembre 2015 Circulo de empresarios
Así está la economía noviembre 2015 Circulo de empresariosAsí está la economía noviembre 2015 Circulo de empresarios
Así está la economía noviembre 2015 Circulo de empresarios
 
Pib-1er trimestre 2016
Pib-1er trimestre 2016Pib-1er trimestre 2016
Pib-1er trimestre 2016
 
Notiplastic enero 2015
Notiplastic enero 2015Notiplastic enero 2015
Notiplastic enero 2015
 
Atrayendo inversiones
Atrayendo inversionesAtrayendo inversiones
Atrayendo inversiones
 
Crisis Económica en el Perú: Breve Balance y Perspectivas. 2009
Crisis Económica en el Perú: Breve Balance y Perspectivas. 2009Crisis Económica en el Perú: Breve Balance y Perspectivas. 2009
Crisis Económica en el Perú: Breve Balance y Perspectivas. 2009
 
INEI - Informe produccion nacional 2014
INEI - Informe produccion nacional 2014INEI - Informe produccion nacional 2014
INEI - Informe produccion nacional 2014
 
Reino unido
Reino unidoReino unido
Reino unido
 

Destacado

Cortland warrior rugby
Cortland warrior rugbyCortland warrior rugby
Cortland warrior rugbydrueben
 
2008 - Gewinnung von OPEN SOURCE Techniken für junge Unternehmen
2008 - Gewinnung von OPEN SOURCE Techniken für junge Unternehmen2008 - Gewinnung von OPEN SOURCE Techniken für junge Unternehmen
2008 - Gewinnung von OPEN SOURCE Techniken für junge UnternehmenBjoern Reinhold
 
Klöckner & Co - Baader Bank AG, Baader Investment Conference, September 24, 2013
Klöckner & Co - Baader Bank AG, Baader Investment Conference, September 24, 2013Klöckner & Co - Baader Bank AG, Baader Investment Conference, September 24, 2013
Klöckner & Co - Baader Bank AG, Baader Investment Conference, September 24, 2013Klöckner & Co SE
 
Universidad autonoma de chihuahuaEvolución de la comunicación humana por medi...
Universidad autonoma de chihuahuaEvolución de la comunicación humana por medi...Universidad autonoma de chihuahuaEvolución de la comunicación humana por medi...
Universidad autonoma de chihuahuaEvolución de la comunicación humana por medi...Alan Almn
 
Operadores cedeu
Operadores cedeuOperadores cedeu
Operadores cedeuaitnas
 
Formato hoja vida_2011
Formato hoja vida_2011Formato hoja vida_2011
Formato hoja vida_2011yeifan
 
Capacidades sector salud iti
Capacidades sector salud  itiCapacidades sector salud  iti
Capacidades sector salud itiRedit
 
Appendices - Draft RiverFIRST Proposal
Appendices - Draft RiverFIRST ProposalAppendices - Draft RiverFIRST Proposal
Appendices - Draft RiverFIRST ProposalRiverFirst Initiative
 
Curriculum Vitae pro
Curriculum Vitae proCurriculum Vitae pro
Curriculum Vitae proProsper Ntuli
 
Administración pública y la ciudadanía: caso del municipio de Patzún
Administración pública y la ciudadanía: caso del municipio de PatzúnAdministración pública y la ciudadanía: caso del municipio de Patzún
Administración pública y la ciudadanía: caso del municipio de PatzúnJorge López-Bachiller Fernández
 
El baz11 gsasp483-training_apolloast
El baz11 gsasp483-training_apolloastEl baz11 gsasp483-training_apolloast
El baz11 gsasp483-training_apolloastSérgio Sacani
 

Destacado (20)

Pprincipales mineras
Pprincipales minerasPprincipales mineras
Pprincipales mineras
 
David herrera
David herreraDavid herrera
David herrera
 
Cortland warrior rugby
Cortland warrior rugbyCortland warrior rugby
Cortland warrior rugby
 
2008 - Gewinnung von OPEN SOURCE Techniken für junge Unternehmen
2008 - Gewinnung von OPEN SOURCE Techniken für junge Unternehmen2008 - Gewinnung von OPEN SOURCE Techniken für junge Unternehmen
2008 - Gewinnung von OPEN SOURCE Techniken für junge Unternehmen
 
Klöckner & Co - Baader Bank AG, Baader Investment Conference, September 24, 2013
Klöckner & Co - Baader Bank AG, Baader Investment Conference, September 24, 2013Klöckner & Co - Baader Bank AG, Baader Investment Conference, September 24, 2013
Klöckner & Co - Baader Bank AG, Baader Investment Conference, September 24, 2013
 
Universidad autonoma de chihuahuaEvolución de la comunicación humana por medi...
Universidad autonoma de chihuahuaEvolución de la comunicación humana por medi...Universidad autonoma de chihuahuaEvolución de la comunicación humana por medi...
Universidad autonoma de chihuahuaEvolución de la comunicación humana por medi...
 
Jóvenes Rurales - Estrategias digitales: Una oportunidad a la vista
Jóvenes Rurales - Estrategias digitales: Una oportunidad a la vistaJóvenes Rurales - Estrategias digitales: Una oportunidad a la vista
Jóvenes Rurales - Estrategias digitales: Una oportunidad a la vista
 
Operadores cedeu
Operadores cedeuOperadores cedeu
Operadores cedeu
 
Formato hoja vida_2011
Formato hoja vida_2011Formato hoja vida_2011
Formato hoja vida_2011
 
Capacidades sector salud iti
Capacidades sector salud  itiCapacidades sector salud  iti
Capacidades sector salud iti
 
Revista Triodos Nº 19
Revista Triodos Nº 19Revista Triodos Nº 19
Revista Triodos Nº 19
 
Appendices - Draft RiverFIRST Proposal
Appendices - Draft RiverFIRST ProposalAppendices - Draft RiverFIRST Proposal
Appendices - Draft RiverFIRST Proposal
 
MS_Reg Sci One Page Flyer 2014-2015
MS_Reg Sci One Page Flyer 2014-2015MS_Reg Sci One Page Flyer 2014-2015
MS_Reg Sci One Page Flyer 2014-2015
 
Curriculum Vitae pro
Curriculum Vitae proCurriculum Vitae pro
Curriculum Vitae pro
 
Administración pública y la ciudadanía: caso del municipio de Patzún
Administración pública y la ciudadanía: caso del municipio de PatzúnAdministración pública y la ciudadanía: caso del municipio de Patzún
Administración pública y la ciudadanía: caso del municipio de Patzún
 
El baz11 gsasp483-training_apolloast
El baz11 gsasp483-training_apolloastEl baz11 gsasp483-training_apolloast
El baz11 gsasp483-training_apolloast
 
ieudla BLAVING
ieudla BLAVINGieudla BLAVING
ieudla BLAVING
 
commons
commonscommons
commons
 
Noah's brochure
Noah's brochureNoah's brochure
Noah's brochure
 
Prog iau09
Prog iau09Prog iau09
Prog iau09
 

Similar a ESTADISTICA DE LA POBLACION

2 Inversión, Tributación y Canon Minero
2 Inversión, Tributación y Canon Minero2 Inversión, Tributación y Canon Minero
2 Inversión, Tributación y Canon Minerotellyspaucar
 
El caracter extractivista y primario exportador de bolivia
El caracter extractivista y primario exportador de boliviaEl caracter extractivista y primario exportador de bolivia
El caracter extractivista y primario exportador de boliviaJuan Carlos Zuleta Calderón
 
Actividad de aprendizaje 8
Actividad de aprendizaje 8Actividad de aprendizaje 8
Actividad de aprendizaje 8Tezhi
 
Analisis del entorno de gasto y personalidades de consumo panamericana
Analisis del entorno de gasto y personalidades de consumo   panamericanaAnalisis del entorno de gasto y personalidades de consumo   panamericana
Analisis del entorno de gasto y personalidades de consumo panamericanaCamilo Herrera
 
Credicorp capital rv260413
Credicorp capital rv260413Credicorp capital rv260413
Credicorp capital rv260413gro77
 
Reporte Diario Bursátil del 31 de Mayo del 2016
Reporte Diario Bursátil del 31 de Mayo del 2016Reporte Diario Bursátil del 31 de Mayo del 2016
Reporte Diario Bursátil del 31 de Mayo del 2016Grupo Coril
 
Cuentas nacionales de primer trimestre 2014
Cuentas nacionales de primer trimestre 2014Cuentas nacionales de primer trimestre 2014
Cuentas nacionales de primer trimestre 2014La Nacion Chile
 
Reporte Diario Bursátil del 12 de Mayo del 2016
Reporte Diario Bursátil del 12 de Mayo del 2016Reporte Diario Bursátil del 12 de Mayo del 2016
Reporte Diario Bursátil del 12 de Mayo del 2016Grupo Coril
 
PROMPERU - guia de mercado EE.UU.
PROMPERU - guia de mercado EE.UU.PROMPERU - guia de mercado EE.UU.
PROMPERU - guia de mercado EE.UU.agroalimentaria.pe
 
ebc202102.pdf
ebc202102.pdfebc202102.pdf
ebc202102.pdfMiriPaz5
 
Revista Economia y Negocios Ecuador 2015
Revista Economia y Negocios  Ecuador 2015Revista Economia y Negocios  Ecuador 2015
Revista Economia y Negocios Ecuador 2015bladyjara
 
ADEX - Boletín Servicios 2014
ADEX - Boletín Servicios 2014ADEX - Boletín Servicios 2014
ADEX - Boletín Servicios 2014Hernani Larrea
 
Reporte Diario Bursátil del 26 de Mayo del 2016
Reporte Diario Bursátil del 26 de Mayo del 2016Reporte Diario Bursátil del 26 de Mayo del 2016
Reporte Diario Bursátil del 26 de Mayo del 2016Grupo Coril
 

Similar a ESTADISTICA DE LA POBLACION (20)

sintesis-tacna-03-2020.pdf
sintesis-tacna-03-2020.pdfsintesis-tacna-03-2020.pdf
sintesis-tacna-03-2020.pdf
 
2 Inversión, Tributación y Canon Minero
2 Inversión, Tributación y Canon Minero2 Inversión, Tributación y Canon Minero
2 Inversión, Tributación y Canon Minero
 
El caracter extractivista y primario exportador de bolivia
El caracter extractivista y primario exportador de boliviaEl caracter extractivista y primario exportador de bolivia
El caracter extractivista y primario exportador de bolivia
 
Actividad de aprendizaje 8
Actividad de aprendizaje 8Actividad de aprendizaje 8
Actividad de aprendizaje 8
 
Analisis del entorno de gasto y personalidades de consumo panamericana
Analisis del entorno de gasto y personalidades de consumo   panamericanaAnalisis del entorno de gasto y personalidades de consumo   panamericana
Analisis del entorno de gasto y personalidades de consumo panamericana
 
Credicorp capital rv260413
Credicorp capital rv260413Credicorp capital rv260413
Credicorp capital rv260413
 
Reporte Diario Bursátil del 31 de Mayo del 2016
Reporte Diario Bursátil del 31 de Mayo del 2016Reporte Diario Bursátil del 31 de Mayo del 2016
Reporte Diario Bursátil del 31 de Mayo del 2016
 
Cuentas nacionales de primer trimestre 2014
Cuentas nacionales de primer trimestre 2014Cuentas nacionales de primer trimestre 2014
Cuentas nacionales de primer trimestre 2014
 
Reporte Diario Bursátil del 12 de Mayo del 2016
Reporte Diario Bursátil del 12 de Mayo del 2016Reporte Diario Bursátil del 12 de Mayo del 2016
Reporte Diario Bursátil del 12 de Mayo del 2016
 
PROMPERU - guia de mercado EE.UU.
PROMPERU - guia de mercado EE.UU.PROMPERU - guia de mercado EE.UU.
PROMPERU - guia de mercado EE.UU.
 
ebc202102.pdf
ebc202102.pdfebc202102.pdf
ebc202102.pdf
 
Indicadores economicos del ecuador
Indicadores economicos del ecuadorIndicadores economicos del ecuador
Indicadores economicos del ecuador
 
Boletin mensual de comercio exterior fedexpor septiembre 2014
Boletin mensual de comercio exterior fedexpor septiembre 2014Boletin mensual de comercio exterior fedexpor septiembre 2014
Boletin mensual de comercio exterior fedexpor septiembre 2014
 
Revista Economia y Negocios Ecuador 2015
Revista Economia y Negocios  Ecuador 2015Revista Economia y Negocios  Ecuador 2015
Revista Economia y Negocios Ecuador 2015
 
INEI - producción 2016
INEI - producción 2016INEI - producción 2016
INEI - producción 2016
 
Informe de Comercio Exterior El Salvador Enero - Junio 2014
Informe de Comercio Exterior El Salvador Enero - Junio 2014Informe de Comercio Exterior El Salvador Enero - Junio 2014
Informe de Comercio Exterior El Salvador Enero - Junio 2014
 
Balanzacomercial.
Balanzacomercial.Balanzacomercial.
Balanzacomercial.
 
ADEX - comercio exterior 2015
ADEX - comercio exterior 2015ADEX - comercio exterior 2015
ADEX - comercio exterior 2015
 
ADEX - Boletín Servicios 2014
ADEX - Boletín Servicios 2014ADEX - Boletín Servicios 2014
ADEX - Boletín Servicios 2014
 
Reporte Diario Bursátil del 26 de Mayo del 2016
Reporte Diario Bursátil del 26 de Mayo del 2016Reporte Diario Bursátil del 26 de Mayo del 2016
Reporte Diario Bursátil del 26 de Mayo del 2016
 

Último

Herramientas de Inteligencia Artificial.pdf
Herramientas de Inteligencia Artificial.pdfHerramientas de Inteligencia Artificial.pdf
Herramientas de Inteligencia Artificial.pdfMARIAPAULAMAHECHAMOR
 
SELECCIÓN DE LA MUESTRA Y MUESTREO EN INVESTIGACIÓN CUALITATIVA.pdf
SELECCIÓN DE LA MUESTRA Y MUESTREO EN INVESTIGACIÓN CUALITATIVA.pdfSELECCIÓN DE LA MUESTRA Y MUESTREO EN INVESTIGACIÓN CUALITATIVA.pdf
SELECCIÓN DE LA MUESTRA Y MUESTREO EN INVESTIGACIÓN CUALITATIVA.pdfAngélica Soledad Vega Ramírez
 
RAIZ CUADRADA Y CUBICA PARA NIÑOS DE PRIMARIA
RAIZ CUADRADA Y CUBICA PARA NIÑOS DE PRIMARIARAIZ CUADRADA Y CUBICA PARA NIÑOS DE PRIMARIA
RAIZ CUADRADA Y CUBICA PARA NIÑOS DE PRIMARIACarlos Campaña Montenegro
 
Planificacion Anual 2do Grado Educacion Primaria 2024 Ccesa007.pdf
Planificacion Anual 2do Grado Educacion Primaria   2024   Ccesa007.pdfPlanificacion Anual 2do Grado Educacion Primaria   2024   Ccesa007.pdf
Planificacion Anual 2do Grado Educacion Primaria 2024 Ccesa007.pdfDemetrio Ccesa Rayme
 
TEMA 13 ESPAÑA EN DEMOCRACIA:DISTINTOS GOBIERNOS
TEMA 13 ESPAÑA EN DEMOCRACIA:DISTINTOS GOBIERNOSTEMA 13 ESPAÑA EN DEMOCRACIA:DISTINTOS GOBIERNOS
TEMA 13 ESPAÑA EN DEMOCRACIA:DISTINTOS GOBIERNOSjlorentemartos
 
Caja de herramientas de inteligencia artificial para la academia y la investi...
Caja de herramientas de inteligencia artificial para la academia y la investi...Caja de herramientas de inteligencia artificial para la academia y la investi...
Caja de herramientas de inteligencia artificial para la academia y la investi...Lourdes Feria
 
Historia y técnica del collage en el arte
Historia y técnica del collage en el arteHistoria y técnica del collage en el arte
Historia y técnica del collage en el arteRaquel Martín Contreras
 
Heinsohn Privacidad y Ciberseguridad para el sector educativo
Heinsohn Privacidad y Ciberseguridad para el sector educativoHeinsohn Privacidad y Ciberseguridad para el sector educativo
Heinsohn Privacidad y Ciberseguridad para el sector educativoFundación YOD YOD
 
cortes de luz abril 2024 en la provincia de tungurahua
cortes de luz abril 2024 en la provincia de tungurahuacortes de luz abril 2024 en la provincia de tungurahua
cortes de luz abril 2024 en la provincia de tungurahuaDANNYISAACCARVAJALGA
 
DECÁGOLO DEL GENERAL ELOY ALFARO DELGADO
DECÁGOLO DEL GENERAL ELOY ALFARO DELGADODECÁGOLO DEL GENERAL ELOY ALFARO DELGADO
DECÁGOLO DEL GENERAL ELOY ALFARO DELGADOJosé Luis Palma
 
OLIMPIADA DEL CONOCIMIENTO INFANTIL 2024.pptx
OLIMPIADA DEL CONOCIMIENTO INFANTIL 2024.pptxOLIMPIADA DEL CONOCIMIENTO INFANTIL 2024.pptx
OLIMPIADA DEL CONOCIMIENTO INFANTIL 2024.pptxjosetrinidadchavez
 
ACUERDO MINISTERIAL 078-ORGANISMOS ESCOLARES..pptx
ACUERDO MINISTERIAL 078-ORGANISMOS ESCOLARES..pptxACUERDO MINISTERIAL 078-ORGANISMOS ESCOLARES..pptx
ACUERDO MINISTERIAL 078-ORGANISMOS ESCOLARES..pptxzulyvero07
 
Estrategia de prompts, primeras ideas para su construcción
Estrategia de prompts, primeras ideas para su construcciónEstrategia de prompts, primeras ideas para su construcción
Estrategia de prompts, primeras ideas para su construcciónLourdes Feria
 
Plan Refuerzo Escolar 2024 para estudiantes con necesidades de Aprendizaje en...
Plan Refuerzo Escolar 2024 para estudiantes con necesidades de Aprendizaje en...Plan Refuerzo Escolar 2024 para estudiantes con necesidades de Aprendizaje en...
Plan Refuerzo Escolar 2024 para estudiantes con necesidades de Aprendizaje en...Carlos Muñoz
 
DE LAS OLIMPIADAS GRIEGAS A LAS DEL MUNDO MODERNO.ppt
DE LAS OLIMPIADAS GRIEGAS A LAS DEL MUNDO MODERNO.pptDE LAS OLIMPIADAS GRIEGAS A LAS DEL MUNDO MODERNO.ppt
DE LAS OLIMPIADAS GRIEGAS A LAS DEL MUNDO MODERNO.pptELENA GALLARDO PAÚLS
 
CALENDARIZACION DE MAYO / RESPONSABILIDAD
CALENDARIZACION DE MAYO / RESPONSABILIDADCALENDARIZACION DE MAYO / RESPONSABILIDAD
CALENDARIZACION DE MAYO / RESPONSABILIDADauxsoporte
 

Último (20)

Herramientas de Inteligencia Artificial.pdf
Herramientas de Inteligencia Artificial.pdfHerramientas de Inteligencia Artificial.pdf
Herramientas de Inteligencia Artificial.pdf
 
SELECCIÓN DE LA MUESTRA Y MUESTREO EN INVESTIGACIÓN CUALITATIVA.pdf
SELECCIÓN DE LA MUESTRA Y MUESTREO EN INVESTIGACIÓN CUALITATIVA.pdfSELECCIÓN DE LA MUESTRA Y MUESTREO EN INVESTIGACIÓN CUALITATIVA.pdf
SELECCIÓN DE LA MUESTRA Y MUESTREO EN INVESTIGACIÓN CUALITATIVA.pdf
 
RAIZ CUADRADA Y CUBICA PARA NIÑOS DE PRIMARIA
RAIZ CUADRADA Y CUBICA PARA NIÑOS DE PRIMARIARAIZ CUADRADA Y CUBICA PARA NIÑOS DE PRIMARIA
RAIZ CUADRADA Y CUBICA PARA NIÑOS DE PRIMARIA
 
Planificacion Anual 2do Grado Educacion Primaria 2024 Ccesa007.pdf
Planificacion Anual 2do Grado Educacion Primaria   2024   Ccesa007.pdfPlanificacion Anual 2do Grado Educacion Primaria   2024   Ccesa007.pdf
Planificacion Anual 2do Grado Educacion Primaria 2024 Ccesa007.pdf
 
TEMA 13 ESPAÑA EN DEMOCRACIA:DISTINTOS GOBIERNOS
TEMA 13 ESPAÑA EN DEMOCRACIA:DISTINTOS GOBIERNOSTEMA 13 ESPAÑA EN DEMOCRACIA:DISTINTOS GOBIERNOS
TEMA 13 ESPAÑA EN DEMOCRACIA:DISTINTOS GOBIERNOS
 
Caja de herramientas de inteligencia artificial para la academia y la investi...
Caja de herramientas de inteligencia artificial para la academia y la investi...Caja de herramientas de inteligencia artificial para la academia y la investi...
Caja de herramientas de inteligencia artificial para la academia y la investi...
 
Historia y técnica del collage en el arte
Historia y técnica del collage en el arteHistoria y técnica del collage en el arte
Historia y técnica del collage en el arte
 
Sesión de clase: Defendamos la verdad.pdf
Sesión de clase: Defendamos la verdad.pdfSesión de clase: Defendamos la verdad.pdf
Sesión de clase: Defendamos la verdad.pdf
 
Power Point: "Defendamos la verdad".pptx
Power Point: "Defendamos la verdad".pptxPower Point: "Defendamos la verdad".pptx
Power Point: "Defendamos la verdad".pptx
 
Heinsohn Privacidad y Ciberseguridad para el sector educativo
Heinsohn Privacidad y Ciberseguridad para el sector educativoHeinsohn Privacidad y Ciberseguridad para el sector educativo
Heinsohn Privacidad y Ciberseguridad para el sector educativo
 
cortes de luz abril 2024 en la provincia de tungurahua
cortes de luz abril 2024 en la provincia de tungurahuacortes de luz abril 2024 en la provincia de tungurahua
cortes de luz abril 2024 en la provincia de tungurahua
 
DECÁGOLO DEL GENERAL ELOY ALFARO DELGADO
DECÁGOLO DEL GENERAL ELOY ALFARO DELGADODECÁGOLO DEL GENERAL ELOY ALFARO DELGADO
DECÁGOLO DEL GENERAL ELOY ALFARO DELGADO
 
OLIMPIADA DEL CONOCIMIENTO INFANTIL 2024.pptx
OLIMPIADA DEL CONOCIMIENTO INFANTIL 2024.pptxOLIMPIADA DEL CONOCIMIENTO INFANTIL 2024.pptx
OLIMPIADA DEL CONOCIMIENTO INFANTIL 2024.pptx
 
Defendamos la verdad. La defensa es importante.
Defendamos la verdad. La defensa es importante.Defendamos la verdad. La defensa es importante.
Defendamos la verdad. La defensa es importante.
 
ACUERDO MINISTERIAL 078-ORGANISMOS ESCOLARES..pptx
ACUERDO MINISTERIAL 078-ORGANISMOS ESCOLARES..pptxACUERDO MINISTERIAL 078-ORGANISMOS ESCOLARES..pptx
ACUERDO MINISTERIAL 078-ORGANISMOS ESCOLARES..pptx
 
Estrategia de prompts, primeras ideas para su construcción
Estrategia de prompts, primeras ideas para su construcciónEstrategia de prompts, primeras ideas para su construcción
Estrategia de prompts, primeras ideas para su construcción
 
Presentacion Metodología de Enseñanza Multigrado
Presentacion Metodología de Enseñanza MultigradoPresentacion Metodología de Enseñanza Multigrado
Presentacion Metodología de Enseñanza Multigrado
 
Plan Refuerzo Escolar 2024 para estudiantes con necesidades de Aprendizaje en...
Plan Refuerzo Escolar 2024 para estudiantes con necesidades de Aprendizaje en...Plan Refuerzo Escolar 2024 para estudiantes con necesidades de Aprendizaje en...
Plan Refuerzo Escolar 2024 para estudiantes con necesidades de Aprendizaje en...
 
DE LAS OLIMPIADAS GRIEGAS A LAS DEL MUNDO MODERNO.ppt
DE LAS OLIMPIADAS GRIEGAS A LAS DEL MUNDO MODERNO.pptDE LAS OLIMPIADAS GRIEGAS A LAS DEL MUNDO MODERNO.ppt
DE LAS OLIMPIADAS GRIEGAS A LAS DEL MUNDO MODERNO.ppt
 
CALENDARIZACION DE MAYO / RESPONSABILIDAD
CALENDARIZACION DE MAYO / RESPONSABILIDADCALENDARIZACION DE MAYO / RESPONSABILIDAD
CALENDARIZACION DE MAYO / RESPONSABILIDAD
 

ESTADISTICA DE LA POBLACION

  • 1. VARIABLES MACROECONÓMICAS MACROECONOMIC VARIABLES La economía peruana mantiene pi- lares financieros moderadamente sólidos: reservas de divisas, deuda debidamente administrada, inflación controlada, tipo de cambio en con- cordancia con la política moneta- ria interna; sin embargo, no es in- mune al incierto marco internacio- nal, donde una ralentización de la economía y la caída de los precios de los metales de exportación in- ciden en la economía nacional. En este contexto, la evolución macroeconómica al cierre del pri- mer trimestre registra comporta- miento positivo y/o esTable . La creación de riqueza expresada en el PBI nacional alcanzó una tasa acumulada de crecimiento de 4.8%; en tanto, a nivel sectorial del PBI Minero agregado del trimestre, ge- neró una variación positiva de 5.2%. Por su parte, los índices de inver- sión respecto al PBI corresponden al 28.2% (público 3.8% y privado 24.4%) en el trimestre. Peru's economy maintains moderate and solid business pillars: foreign currency reserves, properly managed debt, controlled in- flation, and exchange rate in accordance with the domestic mo- netary policy; however, it is still weak to the uncertain internatio- nal frame, where a slowing down of the economy and a fall in the prices of export metals affect the domestic economy. In this con- text, the macroeconomics' development in the first quarter of the year gives as a result a positive and sTable behavior. The wealth creation expressed in the domestic GDP reached an accumulated growth rate of 4.8%; while at sector level of the added mining GDP of the quarter, it generated a positive varia- tion of 5.2%. Meanwhile, the investment rates regarding to the GDP corresponds to 28.2% (3.8% to public investment and 24.4% to private investment). The inflationary pressure and the expectation remain together mainly by the food behavior that recorded an accumulated rate of 1.44% although there are some risks regarding to the increase, derived from the exchange depreciation. The monetary policy conducted by the Banco Central de Reserva de Perú has conti- nued reducing the legal bank reserves in local currency, trying to counteract the liquidity absorption in local currency derived from intervention in the foreign exchange market to avoid deprecia- tion. The result of trade balance recorded the effect of the exports de- crease of traditional products (-19.4%) - mainly miners (-26%) and hydrocarbons (-24.9%) - marked by the decline in imports value (- 2.7%) being the highest proportion of imported goods (78.83%) the ones related to inputs and capital goods. 1 PRIMER TRIMESTRE AVANCE ESTADÍSTICO DEL SUBSECTOR MINERO 2014 1. Variables Macroeconómicas Macroeconomic variables 2. Producción Minera Mining production 3. Exportaciones Mineras Mining exports 4. Cotizaciones Prices 5. Empleo en Minería Employment in mining 6. Inversión Minera Mining investment 7. Cartera de Proyectos Projects Portfolio Año PBI PBI Minero Inflación Tipo Cambio Exportaciones Export. Min. Importaciones Bal. Comercial Year GDP Mining GDP Inflation Exchange rate Exports Mining Exports Imports Commercial balance 2006 7.74% 1.10% 1.14% 3.27 23,830 14,735 14,844 8,986 2007 8.91% 1.70% 3.93% 3.13 28,094 17,439 19,591 8,503 2008 9.80% 7.28% 6.65% 2.93 31,019 18,101 28,449 2,569 2009 0.86% -1.41% 0.25% 3.01 26,962 16,382 21,011 5,951 2010 8.76% -4.79% 2.08% 2.83 35,565 21,723 28,815 6,749 2011 6.86% -3.17% 4.74% 2.75 46,268 27,361 36,967 9,302 2012 6.28% 2.19% 2.65% 2.64 46,228 26,308 41,113 5,115 2013 5.02% 2.17% 2.86% 2.70 41,826 23,030 42,191 -365 2014 Ene / Jan 4.00% 8.30% 3.07% 2.81 2,996 1,432 3,618 -622 Feb / Feb 5.40% 9.90% 3.78% 2.81 3,144 1,546 2,970 174 Mar / Mar 4.90% -1.70% 3.38% 2.81 2,878 1,353 3,368 -490 Tabla 01 / Table 01: PRINCIPALES INDICADORES MACROECONÓMICOS / MAIN MACROECONOMICS INDICATORS La presión inflacionaria y la expectati- va permanecen ancladas, principal- mente por el comportamiento de los alimentos que registraron una tasa acumulanda de 1.44% aunque exis- ten algunos riesgos al alza, derivados de las depreciaciones cambiarias. La política monetaria efectuada por el BCRP ha continuado reduciendo los encajes bancarios en moneda local, tratando de contrarrestar el drenaje de liquidez en moneda local deriva- do de la intervención en el mercado de cambios para contener la depre- ciación. El saldo de la balanza comercial, re- gistró el efecto de la disminución de las exportaciones de productos tradi- cionales (-19.4%) –principalmente mineros (-26%) e hidrocarburos (-24.9%)– acentuado por la disminu- ción del valor de las importaciones (-2.7%), siendo la mayor proporción de bienes importados (78.83%) los correspondientes a insumos y bienes de capital STATISTICAL REPORT OF THE MINING SUBSECTOR - 2014 FIRST QUARTER
  • 2. Año /Year Cobre /Copper Oro/Gold Zinc/Zinc Plata/Silver Plomo/Lead Hierro/Iron Estaño/Tin TMF/FMT gmF/Fine g. TMF/FMT KgF/FMT TMF/Fine kg. TMF/FMT TMF/FMT 2006 1,048,472 202,825,999 1,203,364 3,470,661 313,332 4,784,601 38,470 2007 1,190,274 170,235,864 1,444,361 3,501,462 329,165 5,103,597 39,019 2008 1,267,867 179,870,473 1,602,597 3,685,931 345,109 5,160,707 39,037 2009 1,276,249 183,994,692 1,512,931 3,922,708 302,459 4,418,768 37,503 2010 1,247,184 164,084,389 1,470,450 3,640,465 261,990 6,042,644 33,848 2011 1,235,345 166,186,717 1,256,383 3,418,862 230,199 7,010,938 28,882 2012 1,298,744 161,763,763 1,281,230 3,480,641 249,183 6,684,539 26,105 2013 1,375,641 151,486,072 1,351,273 3,674,283 266,472 6,680,659 23,668 2014 340,555 33,252,974 291,045 845,055 63,232 2,029,349 5,775 Ene / Jan 111,855 11,089,193 100,885 274,725 21,995 644,218 2,015 Ene / Feb 112,895 11,097,358 95,202 280,682 19,442 617,023 1,815 Ene / Mar 115,805 11,066,423 94,958 289,648 21,795 768,108 1,945 Tabla 02 / Table 02: VOLUMEN DE LA PRODUCCIÓN MINERO METÁLICA, POR PRINCIPALES METALES MINING METALLIC PRODUCTION VOLUME, BY MAIN METALS. Principales productos: La evolución en la producción nacional de cobre se mantiene favora- ble en 16.53% en el primer trimestre del año. Las empresas que me- jor desempeño han experimentado son: Minera Milpo, que tuvo un incremento de 31.06% en su producción; Sociedad Minera El Brocal S.A.A. (150.65%), y Compañía Minera Antamina S.A. (27.48%). En tanto, la producción argentífera registró un crecimiento de 1.01%, debido principalmente al aumento obtenido en Compañía Minera Milpo (27.59%), como resultado de la ampliación en su planta Cerro Lindo y una mejora en la extracción de 70.44% en su unidad “Milpo N° 1”; así como al incremento registrado en Volcan Compañía Minera S.A.A. (9.30%), en sus unidades mineras "Carahuacra" y "Colombia". En relación al zinc, en el trimestre se observó una caída de 12.07%, debido a que en la dinámica empresarial nacional, se priorizó la ren- tabilidad generada por las actividades de explotación de cobre, des- plazando las operaciones extractivas de zinc. Así, Compañía Minera Antamina registró una caída del 40.31% en su producción en este metal. Por otro lado, Compañía San Ignacio de Morococha S.A.A. y Trevali Perú S.A.C. registraron incrementos. Como consecuencia de la caída en la producción de las principales empresas auríferas del sector, se observó una descenso de 7.71% en la producción de oro a nivel nacional en este periodo. De este modo, Mra. Yanacocha y Mra. Barrick Misquichilca registraron una disminución del 26.43% y 17.23% respectivamente. Por otro lado, destaca el impetuoso incremento de la producción en este periodo, de la empresa La Arena S.A. (54%), en su unidad minera del mismo nombre PRODUCCIÓN METÁLICA MINING PRODUCTION 2 Main products: The progression of the copper domestic production re- mains favorable with 16.53% in the first quarter of the year. The enterprises which had a better performance are: Minera Milpo, with an increase of 31.06% of its pro- duction, Sociedad Minera El Brocal S.A.A. (150.65%) and Compañía Minera Antamina S.A. (27.48%). Meanwhile, the silver production recorded a growth of 1.01% mainly due to the increase achieved in Compañía Minera Milpo (27.59%), as a result of the expansion of the Cerro Lindo plant, and an increase of 70.44% in the "Milpo Nº1" unit, also considering the registered increase in Volcan Compañía Minera S.A.A. (9.30%), in the "Ca- rahuacra" and "Colombia" mining units. During the quarter period of the year, the zinc produc- tion faced a decrease of 12.07%, due to the profitability generated by copper exploitation, placing it above the zinc extraction operations. The production of the Com- pañía Minera Antamina also decreased 40.31% regar- ding to this metal. By the other hand, the Compañía San Ignacio de Morococha S.A.A and Trevali Perú S.A.C re- corded a notable growth of their production. As a consequence of the production decrease of the prin- ciple gold enterprises of the sector, there was a fall of 7.71% of the gold production nationwide in this period. Then, Minera Yanacocha and Minera Barrick Misquichil- ca faced a decrease of 26.43% and 17.23% respectively. By the other hand, the rapid growing of La Arena enter- prise production (54%) stands out in this period.
  • 3. EXPORTACIONES MINERAS MINING EXPORTS 3 Tabla 03 / Table 03: EXPORTACIONES MINERAS POR PRINCIPALES PRODUCTOS / MINING EXPORT BY MAIN PRODUCTS EXPORTACIONES/Exports UNIDAD//Unit 2009 2010 2011 2012 2013 ENE-MAR 2013 2014 Var. % Cobre Valor (US$MM) 5,934 8,870 10,711 10,694 9,809 1,986 2,397 1,986 -17.15% Copper Cantidad (Miles Tm) 1,246 1,254 1,257 1,401 1,401 295 314 295 -6.15% Precio* (Ctvs US$/Lb.) 214 321 387 346 3,834 306 346 306 -11.72% Oro Valor (US$MM) 6,805 7,756 10,104 9,542 7,846 1,182 2,229 1,182 -46.97% Gold Cantidad (Miles Oz. Tr.) 6,987 6,346 6,415 5,709 5,555 915 1,369 915 -33.15% Precio* (US$/Oz Tr.) 974 1,225 1,570 1,670 16,932 1,291 1,628 1,291 -20.69% Zinc Valor (US$MM) 1,233 1,691 1,522 1,342 1,412 357 351 357 1.71% Zinc Cantidad (Miles Tm.) 1,373 1,310 1,007 1,010 1,078 264 250 264 5.93% Precio* (Ctvs US$/Lb.) 39 59 69 60 722 61 64 61 -4.08% Plata Valor (US$MM) 214 118 219 210 479 136 80 136 70.00% Silver Cantidad (Millones Oz. Tr.) 16 6 7 7 21 7 2.7 7 148.15% Precio* (US$/Oz. Tr.) 14 19 34 30 287 20 30 20 -32.23% Plomo Valor (US$MM) 1,116 1,579 2,424 2,503 1,749 282 343 282 -17.78% Lead Cantidad (Miles Tm.) 681 770 986 1,140 847 139 144 139 -3.62% Precio* (Ctvs US$/Lb.) 72 92 113 100 1,141 92 108 92 -14.62% Estaño Valor (US$MM) 479 663 755 541 496 92 135 92 -31.85% Tin Cantidad (Miles Tm.) 38 34 29 26 22 4 6 4 -26.79% Precio* (Ctvs US$/Lb.) 553 902 1,183 948 12,096 1,016 1,093 1,016 -7.01% Hierro Valor (US$MM) 298 523 1,023 856 857 216 240 216 -10.00% Iron Cantidad (Miles Tm.) 7 8 9 10 10 3 2.7 3 11.11% Precio* (US$/Tm) 44 68 113 88 989 71 91 71 -21.33% Molibdeno Valor (US$MM) 276 492 571 431 358 76 69 76 10.14% Molybdenum Cantidad (Miles Tm.) 12 17 19 18 18 4 3 4 28.13% Precio* (Ctvs US$/Lb.) 1,021 1,337 1,342 1,091 10,719 845 968 845 -12.68% Otros / Other Valor (US$MM) 28 29 31 22 23 3 2 3 55.95% TOTAL US$ MM 16,382 21,723 27,361 26,142 23,030 4,330 5,846 4,330 -25.93% Exportaciones mineras: En el trimestre, el volumen de exportación del sector minero representó el 70% del total de productos tradicionales y el 48.2% de la exportación total; siendo el cobre y el oro, los productos más exportados, sin embar- go, los menores volúmenes embarcados incidieron en el resultado del sector minero, disminuyendo el resultado general en 23.5% respecto al valor reportado en el trimestre del año anterior. En enero, el volumen de cobre retrocedió en 17,4% debido a la menor demanda del mercado chileno (-89,4%); asimismo, no reporto exporta- ción hacia Alemania a diferencia de enero de 2013. De igual forma; Ca- nadá, Suiza y Estados Unidos de América reportaron disminución en los volúmenes de compra del oro. En febrero, el volumen exportado de oro retrocedió en 52,6% debido a la menor demanda del mercado suizo, canadiense y norteamericano. Mien- tras que, las exportaciones de cobre reportaron un incremento de 29,3%, por las mayores compras de China y Alemania. Finalmente; en marzo, el principal mercado de destino del cobre peruano fue China pero disminuyó sus compras en 25,5%; por su parte, los en- víos de oro se redujeron en 44,3%; ante la menor demanda del mercado suizo, canadiense y estadounidense During the quarter period of the year, the export volume of the mining sector represented 70% of the total domes- tic products, and 48.2% of the total export; copper and gold were the most exported products, nevertheless, the lowest products volume exported had an impact on the mining sector result, causing a decrease of 23.5% of the general result regarding to the reported value in the last year quarter. In January, the copper volume decline 17.4% due to the lowest demand of the Chilean market (89.4%); also, the- re was not export to Germany unlike January 2013. Likewise, Canada, Switzerland and United States face a decrease in the gold sale volume. In February, the copper volume decreased 52.6% due to the low demand of the Switzerland, Canadian and North American market. Meanwhile, the copper exportations report an increase of 29.3% caused by the great purcha- se quantity of China and Germany. Finally, in March, the principle market destination of Pe- ruvian copper was China but the sales reduced 25.5%; on the other hand, the gold exports decreased 44.3%; in front of the Switzerland, Canada and United States mar- ket.
  • 4. COTIZACIÓN DE PRINCIPALES METALES MAIN METALS PRICES 4 Año/Year Cobre/Copper Oro/Gold Zinc/Zinc Plata/Silver Plomo/Lead Estaño/Tin Ctvs. US$/lb. US$/Oz. Tr. Ctvs. US$/lb. US$/Oz. Tr. Ctvs. US$/lb. Ctvs. US$/lb. 2006 304.91 604.58 148.56 11.57 58.50 398.29 2007 322.93 697.41 147.07 13.42 117.03 659.47 2008 315.51 872.72 85.04 15.01 94.83 839.60 2009 233.52 973.62 75.05 14.68 77.91 615.83 2010 342.28 1,225.29 98.18 20.19 97.61 926.63 2011 400.20 1,569.53 99.50 35.17 108.97 1,183.96 2012 360.55 1,669.87 88.35 31.17 93.54 958.08 2013 332.31 1,411.00 86.65 23.86 97.17 1,012.24 2014 319.25 1,293.95 92.05 20.48 95.49 1,027.83 Ene / Jan 330.89 1,244.80 92.46 19.87 97.47 1,001.15 Feb / Feb 324.42 1,300.98 92.32 20.85 95.73 1,034.61 Mar / Mar 302.45 1,336.08 91.37 20.72 93.27 1,047.72 Tabla 04 / Table 04: COTIZACIONES, POR PRINCIPALES METALES / PRICES, BY MAIN METALS Oro: En enero, el precio promedio del oro fue de US$/oz.tr. 1,244.8 mayor en 1.8% respecto del mes anterior. Esta subida fue alentada por la caída de los índices bursátiles inter- nacionales que incrementaron la demanda por el metal precioso como activo de refu- gio, y en medio de una mayor compra pro- veniente de China antes del feriado por el Año Nuevo Lunar chino. En febrero, el oro cotizó en US$/oz.tr. 1,301; mayor en 4.5% respecto del mes anterior. Este comporta- miento al alza se explicó por la depreciación del dólar frente al euro y por la mayor de- manda física para joyería, monedas y ba- rras de oro a inicios de mes, principalmente de China e India. Finalmente, el precio pro- mediodeloroenmarzofueUS$/oz.tr.1,336.1; mayoren2.7% respectodelmesanterior.Este comportamiento estuvo sustentado en la de- preciación del dólar frente al euro y en la ma- yor demanda como activo de refugio por la crisis rusa-ucraniana. Cobre: Durante enero, el precio del cobre promedió US$/lb. 3.31, aumentando 1.3% respecto de diciembre. El aumento se sustentó en las señales de poca disponibilidad de cobre en los depósitos de la Bolsa de Metales de Lon- dres ante demoras de suministros por las huelgas portuarias en Chile. El precio del cobre promedió US$/lb. 3.24 en febrero, menor en 2.0% respecto de ene- ro. El precio de cobre se redujo por preocu- paciones sobre la demanda de China, por el fuerte incremento de la producción de Glencore Xstrata en sus minas de África y Chile, así como por las mayores existencias de cobre en China. En marzo, el precio del cobre promedió US$/ lb. 3.02; menor en 6.8% respecto de febre- ro. La reducción se produjo por los mayo- res temores de desaceleración de China (tras difusión de datos negativos de comercio y crédito), y por el aumento de los inventarios de cobre en dicho país. Zinc: La cotización promedio en enero fue US$/ lb. 0.93; mayor en 3.3% respecto del mes previo. Este incremento reflejó el dato del reporte del Grupo Internacional de Estudios del Zinc y Plomo (ILZSG) que señaló un dé- ficit en el mercado mundial de zinc refina- do entre enero y noviembre de 2013; así como de ajustados suministros a corto pla- zo. En febrero fue US$/lb. 0.92; disminuyendo 0.1% respecto del mes previo. Cayó por ex- pectativas de menor demanda ante débiles datos económicos de Estados Unidos y Chi- na, aunque la escasez a corto plazo -reflejado en los menores inventarios- atenuó la caída. Finalmente, la cotización promedio del zinc en marzo fue US$/lb. 0.91, disminuyendo 1,0% respecto del mes previo. Esta caída reflejó el aumento de existencias en las prin- cipales bolsas de metales del mundo y los temores de que la desaceleración económi- ca de China afecte la demanda del metal Gold.- In January, the average price of gold was US$/oz.tr.1,244.8, resulting in 1.8% more than the last month. This rising was encourage by the fall of the international stock index that incremented the demand for the precious metal as a haven asset, and, in the middle of a major purchase from China before the Lunar New Year holiday. In February, the gold price was US$/oz.tr.1,301, resulting in 4.5% more than the last month. This increase is due to the dollar depreciation with respect to the euro and the greater physical demand for jewelry, coins and gold barriers in ear- ly February, mainly in China and India. Fi- nally, the average gold price in March was US$/oz.tr.1,336.1, resulting in 2.7% more in relation to last month. This tendency was supported by the dollar depreciation with respect to the euro and the greater demand as a haven asset by the Russian- Ukrainian crisis. Copper.- During January, the copper price average from US$/lb.3,31 growing 1.3% in relation to December. The growing was supported by the signs of the limited cop- per availability in the deposits in the Lon- don Metal Exchange regarding to the su- pply delay due to the port strikes in Chile. In February, the copper price average from US$/lb.3.24, decreasing 2.0% with respect of January. The copper price reduced due to the worry concerning the China de- mand, because of the stronger production increase of Glencore Xstrata and its Africa and Chile mines, also because of the grea- ter copper existence in China. In March, the copper price average from US$/lb.3,02 decreasing 6.8% with respect of February. This decrease was caused by the biggest fear of China desaceleration (Continue on next page)
  • 5. EMPLEO EN MINERÍA MINING EMPLOYMENT5 Año Contratista Compañia Total Year Contractor Company Total 2006 40,633 67,860 108,493 2007 54,613 80,368 134,981 2008 60,783 66,243 127,026 2009 58,987 67,096 126,083 2010 67,575 97,956 165,531 2011 73,257 102,073 175,330 2012 85,470 128,521 213,991 2013 67,950 140,433 208,383 2014 63,116 122,937 186,053 Ene / Jan 62,579 123,627 186,206 Feb / Feb 65,101 125,788 190,889 Mar / Mar 61,669 119,395 181,064 Tabla 05 / Table 05: EMPLEO DIRECTO EN MINERÍA, PROMEDIO TRABAJADORES / DIRECT EMPLOYMENT IN MINING, AVERAGE NUMBER OF WORKERS Empleo directo: Con relación a la actividad minera, un pro- medio de 186,053 empleos directos han sido reportados por los titulares de la actividad minera durante el primer trimestre del año 2014. En tanto que en las regiones; durante el pri- mer trimestre del año, 5 regiones concentran la mayor cantidad de empleos generados por la actividad minera. En primer lugar se encuentra la región Arequipa, con un total de 26,659 empleos directos, representando el 14.33% del pro- medio total; en segundo lugar, se ubica la re- gión Junín con 19,833 empleos (10.66 %); luego siguen: La Libertad con 16,588 em- pleos; Pasco con 16,444 empleos; y Lima con 13,518 empleos (8.92%, 8.84%, 7.27% del promedio total, respectivamente) (after the trade and credit negative data broadcasting), and by the increase of the copper stock in that country. Zinc.- In January, the average cost of zinc was US$/lb.0,93 growing 3.3% with res- pect of the last month. This increase show the report information from the Interna- tional Lean and Zinc Study Group which reported a deficit of the world refined zinc market between January and November of 2013; as the supply small quantity in short term. In February, the zinc production was US$/ lb. 0.92; having a decrease of 0.1% com- paring to last month. The decrease was caused by the lower demand expectatio- ns of weak economic information from United States and Chile, although the short term scarcity showed in the mi- nor inventories, alleviate the falling. Finally, the average zinc price in Mar- ch was US$/lb. 0.91, having a decrea- se of 1.0% comparing to last month. The decrease showed the existence increase in the main metal exchanges in the world and the fears that the eco- nomic deceleration of China affects the metal demand. Regarding to mining activity, an average of 186,053 direct employments has been reported by the mining activity headlines during the first quarter of 2014. During this period of the year, 5 regions concentrate the major employment quan- tity generated by the mining activity. In first place, there is Arequipa with a total of 26,659 direct employments, re- presenting the 14,33% of the total ave- rage; in second place, there is Junín with 19,833 employments (10.66%), La Liber- tad with 16,588 employments (8.92%); Pasco with 16,444 employments (8.84%),and finally Lima with 13,518 employments (7.27% of the total avera- ge).
  • 6. INVERSIÓN MINERA MINING INVESTMENT6 Año Eq. de Planta. Eq. Minero Exploración Explotación Infraestructura Otros Preparación Total Year Plant. Eq.. Mining Eq. Exploration Exploitation Infrastructure Others Preparation Total 2006 63,538,746 124,092,578 102,387,499 340,970,408 640,626,630 273,461,734 64,837,125 1,609,914,721 2007 63,768,994 125,551,262 136,592,095 338,016,660 336,788,377 197,918,361 50,179,973 1,248,815,722 2008 141,038,944 176,688,012 167,839,351 440,246,645 321,482,441 328,783,686 131,980,228 1,708,059,306 2009 319,825,374 499,659,327 393,534,656 531,388,349 376,380,329 504,747,514 196,060,821 2,821,596,371 2010 416,011,993 518,078,947 615,815,227 737,890,193 827,591,969 443,780,328 510,276,007 4,069,444,664 2011 1,124,690,664 776,137,869 865,423,284 869,691,352 1,406,853,178 1,412,347,788 788,223,911 7,243,368,046 2012 1,139,598,256 525,252,803 905,401,645 1,005,399,266 1,797,081,533 2,491,858,829 638,740,607 8,503,332,940 2013 1,404,301,909 778,849,649 774,008,005 1,071,915,417 1,709,625,770 3,629,234,450 351,088,998 9,719,024,198 2014 186,498,762 125,710,928 143,923,382 238,163,428 294,924,078 921,157,620 64,783,016 1,975,161,215 Ene / Jan 51,565,155 34,224,548 39,198,206 72,397,041 79,670,285 267,535,375 15,587,069 560,177,678 Feb / Feb 57,187,441 44,193,000 42,658,925 79,558,556 111,242,375 323,767,963 18,899,606 677,507,866 Mar / Mar 77,746,166 47,293,380 62,066,250 86,207,832 104,011,418 329,854,283 30,296,342 737,475,672 Tabla 06 / Table 06: INVERSIONES MINERAS EN US$, SEGÚN RUBRO / MINING INVESTMENTS IN US$, ACCORDING TO EACH FIELD Análisis: La inversión minera en el pri- mer trimestre del 2014, ascen- dió a US$ 1,975 millones; va- lor superior en 1.8% a la inver- sión ejecutada en el mismo pe- riodo del año 2013, que fue de US$ 1,940 millones. Según el tipo de inversión re- gistrada en este periodo, el cre- cimiento de las inversiones se dió en el rubro infraestructura (12.2%) y Otros (24.2%). En contraposición, se apreció una reducción en las inversiones destinadas a Equipamiento de Planta de Beneficio (-24.3%), explicado por la menor inver- sión reportada por Minera Chinalco, que inició operacio- nes en el presente año. RUBROS 2013 2014 Variacion % EQ. DE PTA DE BENEFICIO 246,286,434 186,498,762 -24.28% EQ. MINERO 150,688,254 125,710,928 -16.58% EXPLORACIÓN 185,370,235 143,923,382 -22.36% EXPLOTACIÓN 263,563,456 238,163,428 -9.64% INFRAESTRUCTURA 262,892,859 294,924,078 12.18% OTROS 741,905,443 921,157,620 24.16% PREPARACIÓN 89,506,707 64,783,016 -27.62% TOTAL GENERAL 1,940,213,388 1,975,161,215 1.80% During the first quarter of 2014, the mining investment increased to US$ 1,975 millions, an exceeded value in 1.8% to the investment of US$ 1,940 million made in the same period of 2013, According to the investment type registered during this period, the investments growth was mainly observed in the infrastructure field (12.2%) and Others (24.2%). On the other hand, there was a decrease in the investments destined to the Equipment of the Beneficial plant (-24.3%) explained by the minor investment reported by Minera Chinalco which began operations this year. During the first quarter of the year, 426 companies re- ported investments made in this period. Sociedad Mine- ra Cerro Verde (US$ 440 million), Xstrata Las Bambas (US$ 352 millions) and Hudbay Perú S.A.C. (US$ 175 millions) are the companies that stand out of this group. Meanwhile at regional level, Arequipa stands out as lea- der of investments made in its jurisdiction where it re- ported US$ 495 millions followed by Apurímac (US$ 358 millions), Cusco (US$ 139 millions), Junín (US$ 139 millio- ns) and La Libertad (US$ 135 millions) among others. De las 426 empresas que re- portaron inversiones ejecuta- das en el primer trimestre del año, destacan las realizadas por Sociedad Minera Cerro Verde S.A.A. (US$ 440 millo- nes), Xstrata Las Bambas (US$ 352 millones) y Hudbay Perú S.A.C. (US$ 175 millo- nes). En tanto, a nivel regional, Arequipa destaca como líder de inversiones ejecutadas en su jurisdicción al registrar US$ 495 millones seguida por Apurímac (US$ 358 millones), Cusco (US$ 290 millones), Junín (US$ 139 millones) y La Libertad (US$ 135 millones, entre otras
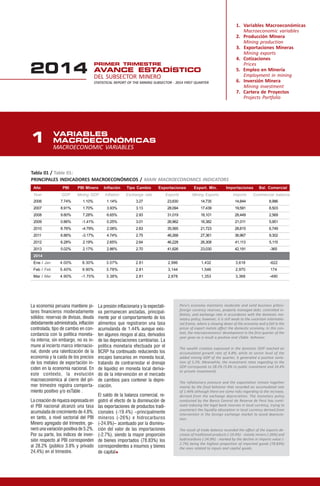
  • 7. CARTERA PROYECTOS MINEROS ESTIMATED MINING PROJECTS PORTFOLIO7 AMPLIACIONES / Expansion COMPAÑIA MINERA MISKI MAYO S.R.L. Ampliación Bayovar PIURA, SECHURA, SECHURA Fosfatos 520 SOCIEDAD MINERA CERRO VERDE S.A.A. Ampliación Cerro Verde AREQUIPA, AREQUIPA, YARABAMBA Cu 4,600 SOCIEDAD MINERA EL BROCAL S.A.A. Ampliación Colquijirca PASCO, PASCO, TINYAHUARCO Polimetálico 432 SOUTHERN PERU COPPER CORP. Ampliación Fundición MOQUEGUA, ILO, PACOCHA Cu Por definir SHOUGANG HIERRO PERU S.A.A. Ampliación Marcona ICA, NAZCA, MARCONA Fe 1,500 SOUTHERN PERU COPPER CORP. Ampl. Refinería de Ilo MOQUEGUA, ILO, PACOCHA Cu Por definir SOUTHERN PERU COPPER CORP. Ampliación Toquepala TACNA, JORGE BASADRE, ILABAYA Cu 1,050 MINERA CHINALCO PERÚ S.A. Ampliacion Toromocho JUNIN, YAULI, MOROCOCHA Cu 1,320 CON E.I.A. APROBADO / With E.I.A. Approved ANABI S.A.C. Anama APURIMAC, ANTABAMBA, HUAQUIRCA Au 40 HUDBAY PERU S.A.C. Constancia CUSCO, CHUMBIVILCAS, CHAMACA Y LIVITACA Cu 1,790 BEAR CREEK MINING COMPANY Corani PUNO, CARABAYA, CORANI Ag 750 COMPAÑIA MINERA ARES S.A.C. Crespo CUSCO, CHUMBIVILCAS, SANTO TOMAS Au - Ag 110 MINERA SHOUXIN PERU S.A. Explotacion de relaves ICA, NAZCA, MARCONA Cu, Fe, Zn 239 MINERA SUYAMARCA S.A.C. Inmaculada AYACUCHO, PARINACOCHAS - OYOLO Au - Ag 370 INVICTA MINING CORP S.A.C. Invicta LIMA, HUAURA, LEONCIO PRADO Polimetálico 93 XSTRATA LAS BAMBAS S.A. Las Bambas APURIMAC, COTABAMBAS, CHALHUAHUACHO Cu 5,895 MINERA YANACOCHA S.R.L. Minas Conga CAJAMARCA, CAJAMARCA, BAÑOS DEL INCA Cu, Au 4,800 COMPAÑIA MINERA KURI KULLU S.A. Ollachea PUNO, CARABAYA, OLLACHEA Au 170 FOSFATOS DEL PACIFICO S.A. Fosfatos PIURA, SECHURA, SECHURA Fosfatos 500 ANGLO AMERICAN QUELLAVECO S.A. Quellaveco MOQUEGUA, MARISCAL NIETO, TORATA Cu 3,300 RELIANT VENTURES S.A.C. San Luis ANCASH, YUNGAY, SHUPLUY Au y Ag por definir MINERA SULLIDEN SHAHUINDO S.A.C. Shahuindo CAJAMARCA, CAJAMARCA, CACHACHI Au 208 MINERA CHINALCO PERÚ S.A. Toromocho JUNIN, YAULI, MOROCOCHA Cu 3,500 CON EIA PRESENTADO / With Environmental Assessments under Evaluation COMPAÑIA MINERA MILPO S.A.A. Pukaqaqa HUANCAVELICA, HUANCAVELICA, HUANDO Cu-Mo 630 BEAR CREEK MINING COMPANY Santa Ana PUNO, CHUCUITO, HUACULLANI Ag 71 CÍA DE MINAS BUENAVENTURA S.A.A. Tambomayo AREQUIPA, CAYLLOMA, TAPAY Au, Ag 130 SOUTHERN PERU COPPER CORP. Tia Maria AREQUIPA, ISLAY, COCACHACRA Cu 1,000 EN EXPLORACIÓN / Exploration EXPLORACIONES COLLASUYO S.A.C. Accha CUSCO, PARURO, ACCHA Zn, Pb 346 ANABI S.A.C. Anubia APURIMAC, ABANCAY, CURAHUASI Cu 90 CAÑARIACO COPPER PERU S.A. Cañariaco LAMBAYEQUE, FERREÑAFE, CAÑARIS Cu 1,599 JUNEFIELD GROUP S.A. Cercana AREQUIPA, AREQUIPA, YARABAMBA Cu MINERA CUERVO S.A.C. Cerro Ccopane CUSCO, PARURO, OMACHA Fe - CANTERAS DEL HALLAZGO S.A.C. Chucapaca MOQUEGUA, GRAL.SANCHEZ CERRO, ICHUÑA Au 1,200 MINSUR S.A. Expl. Bofedal II PUNO, MELGAR, ANTAUTA Sn 165 MANTARO PERU S.A.C. Fosfatos Mantaro JUNIN, CONCEPCION, ACO Fosfatos 850 LUMINA COPPER S.A.C. Galeno CAJAMARCA, CELENDIN, CELENDIN Cu, Mo, Au, Ag 2,500 MINERA ANTARES PERU SAC Haquira APURIMAC, COTABAMBAS, CHALHUAHUACHO Cu-Mo 2,800 APURIMAC FERRUM S.A. Hierro Apurimac APURIMAC, ANDAHUAYLAS, ANDAHUAYLAS Fe 2,300 COMPAÑIA MINERA MILPO S.A.A. Hilarión ANCASH, BOLOGNESI, HUALLANCA Zn 470 RIO TINTO MINERA PERU LIMITADA SAC La Granja CAJAMARCA, CHOTA, QUEROCOTO Cu 1,000 HAMPTON MINING PERU SAC Los Calatos MOQUEGUA, MARISCAL NIETO, MOQUEGUA Cu-Mo 1,320 SOUTHERN PERU COPPER CORP. Los Chancas APURIMAC, AYMARAES, POCOHUANCA Cu 1,560 COMPAÑIA MINERA MILPO S.A.A. Magistral ANCASH, PALLASCA, CONCHUCOS Cu 750 MARCOBRE S.A.C. Marcobre (Mina Justa) ICA, NAZCA, SAN JUAN DE MARCONA Cu 744 ANGLO AMERICAN MICHIQUILLAY S.A. Michiquillay CAJAMARCA, CAJAMARCA, LA ENCAÑADA Cu 700 JINZHAO MINING PERU S.A. Pampa de Pongo AREQUIPA, CARAVELI, BELLA UNION Fe 3,280 COMPAÑIA MINERA QUECHUA S.A. Quechua CUSCO, ESPINAR, ESPINAR Cu 490 COMPAÑIA MINERA CENTAURO S.A. Quicay II PASCO, PASCO, SIMON BOLIVAR Au, Cu 3,000 RIO BLANCO COPPER S.A. Río Blanco PIURA, HUANCABAMBA, Cu 1,500 COMPAÑIA MINERA VICHAYCOCHA S.A.C. Rondoni HUANUCO, AMBO, CAYMA Cu 350 AMERICAS POTASH PERU S.A. Salmueras de Sechura PIURA, SECHURA, SECHURA Potasio 125 TOTAL US$ MM 61,279 EMPRESA PROYECTO REGION/PROVINCIA/DISTRITO MINERAL INVERSION US$ MM COMPANY PROJECT REGION / PROVINCE / DISTRICT MINERAL INVESTMENT Tabla 07 / Table 07: CARTERA PROYECTOS MINEROS / ESTIMATED MINING PROJECTS PORTFOLIO
  • 8. PUERTO CHUCAPACA CERRO VERDE CERCANA ZAFRANAL TAMBOMAYOPAMPA DE PONGO CORANI QUECHUACONSTANCIA CRESPO CCOPANE HAQUIRA INMACULADA LOS CHANCAS APURIMAC F. MARCONA JUSTA PUKAQAQA RONDONI QUICAY II TOROMOCHO FOSF. MANTARO INVICTA COLQUIJIRCA HILARION SAN LUIS MAGISTRAL SHAHUINDO CONGA GALENO MICHIQUILLAY LA GRANJA CAÑARIACO BAYOVAR S. SECHURA RIO BLANCO P. FOSFATOS LOS CALATOS OLLACHEA SANTA ANA ACCHA ANUBIA Tacna Moquegua Arequipa Puno Cusco Madre de Dios Apurimac Ayacucho Huancavelica Ica Ucayali Junín Pasco Huánuco Lima Ancash San Martín Loreto AmazonasCajamarca Piura Lambayeque La Libertad Tumbes SHOUXIN CARTERA PROYECTOS MINEROS ESTIMATED MINING PROJECTS PORTFOLIO