SlideShare una empresa de Scribd logo
1 de 2
Descargar para leer sin conexión
HUANUCO
  La región Huánuco concentra el 97% de su oferta
  exportable en la minería. Su principal exportación no
  tradicional proviene del sector agro-agroindustrial
  como: cacao (grano, pasta, orgánico), tara, flores
  (Hortensias) son los más representativos, el 2010
  ascendieron a 10,503,608.16 dólares manifestando
  un crecimiento de 47% más que el 2009. Su actividad
  maderable de exportación aparece el 2010 con ventas
  de 161,706.20 dólares. La región ha invertido consi-
  derablemente en redes viales para mejorar su
  interconexión. El aseguramiento de la salud ha tenido
  un importante avance, así como la mejora de gasto y
  recaudación del gobierno. Su retos a futuro están en
  mejorar la educación orientada hacia la investigación
  y desarrollo, la generación de valor agregado a su
  actividad productiva. Un trabajo orientado a la
  promoción de la inversión privada en la zona para
  transformar bienes en el sector agrícola y de minería
  no metálica son agenda a futuro en su planificación.
                                                                          Superficie       Capital Dpto.            Altitud     Provin-
                                                                            Km2                                     m.s.n.m.     cias
 Area / Sexo         Masculino           Femenino             Total
                                                                            36,849            Huánuco                1,912        11
    Urbano             147,774           153,5955            301,369
     Rural             272,044            253,519            525,563       Densidad        PBI Per cápita        PEA            Distri-
                                                                           Hab/Km2             2009             Ocupada          tos
                                                                                          (Nuevos Soles)         2009
      Total Habitantes y                 Población          826,932
    Distribución x Sexo (*)              Huánuco                             21.14            4,359.76              457,342       76

 (*) Actualizado en función a estimaciones y proyecciones 2010 del INEI   (*) Actualizado según ICRP 2010—Centrum                          (*) Extraído del Estudio de ICRP Centrum—2010


POTENCIALIDADES:                                                                                                                                                                                     MADERA
                                                                     AGROINDUSTRIA                                                PESCA                         ARTESANIA                            MUEBLES


                                             - Yacón                              - Rocoto                                    - Trucha                       - Cabuya                            - Parquet
                                             - Papa nativa                        - Uña de gato                                                              - Madera topa                       - Madera ase-
                                             - Orquídeas                          - Bastón del                                                                                                   rrada
                                                                                  emperador


RED DE INSTITUCIONES FACILITADORAS DEL COMERCIO EXTERIOR DE HUÁNUCO:
                                              C.C. Huánuco                                    COFIDE                                         DRA Huánuco                                      DIRCETUR-Huánuco
                                              Gob. Reg. Huánuco                                                                                                                               SERPOST—Huánuco


EXPORTACIONES DE PRODUCTOS TRADICIONALES Y NO TRADICIONALES del 2010:(FOB en miles de US$)
                                                                                                     EXPORTACIONES NO TRADICIONALES 2010
                                                                                                                                                                                                  Total Producto               TOTAL SECTOR
                SECTOR                                           PRODUCTO                                                                 MERCADO
                                                                                                                                                                                                     FOB USD                     FOB USD
                                                                                                      Países Bajos, Alemania, Bélgica, Brasil, Canadá, Colombia,
                                       CACAO (GRANOS, MANTECA, COVERTU-
                                                                                                      Corea del Sur, España, Estados Unidos, Italia, Montenegro,                                          9,995,188.88
                                       RA, POLVO, LICOR)
                                                                                                      Nueva Zelandia, Reino Unido y Singapur
                                       TARA                                                           Argentina, Brasil, Italia y Uruguay                                                                    283,848.21
                 AGRO                                                                                                                                                                                                               10,503,608.16
                                       SEMILLAS FORESTALES                                            Colombia                                                                                                98,773.55
                                       FLORES (HORTENCIAS)                                            España y Estados Unidos                                                                                 69,627.75
                                       OTROS (HORTALIZAS, VERDURAS Y ALI-
                                                                                                      Albania, Alemania, Brasil y Estados Unidos                                                              56,169.77
                                       MENTO BALANCEADO)
               MADERA                  TABLILLAS Y FRISOS PARA PARQUÉS                                China                                                                                                  161,706.20                 161,706.20
                                       ABONOS MINERALES                                               Bolivia                                                                                                 19,200.00
              QUIMICO                                                                                                                                                                                                                    56,984.00
                                       PLAGUICIDAS Y HERBICIDA                                        Bolivia                                                                                                 37,784.00
                                                                                                                                                                                   TOTAL                 10,722,298.36              10,722,298.36


                                                                                                        EXPORTACIONES TRADICIONALES 2010
                                                                                                                                                                                                                            Total Producto
               SECTOR                                           PRODUCTO                                                                              MERCADO                                                                  FOB USD
               MINERÍA                                         PLOMO Y ZINC                           China, Brasil, España                                                                                                       21,566,618.62
                AGRO                                              CAFÉ                                Alemania, Canadá, Reino Unido, Montenegro, Corea del Sur                                                                      4,029,587.96
                                                                                                      TOTAL                                                                                                                         25,596,206.58


           Elaboración PROMPERU                                                                       Fuente: Infotrade—PROMPERU y SUNAT                                              Cifras referenciales según información de Ubicación Geográfica
HUANUCO
PRINCIPALES EMPRESAS EXPORTADORAS DE LA REGION HUÁNUCO (FOB en US$)

                                                                                                                                                                      2010
                                   N°                RUC                  EMPRESA                                                                                 FOB USD

                                    1
                                              20100163552                 CIA MINERA RAURA S A                                                                 17,038,152.79
                                    2
                                              20136264053                 COOPERATIVA AGRARIA INDUSTRIAL NARANJILL                                             11,744,268.27
                                    3
                                              20259150117                 AYS S.A.                                                                               4,528,465.83
                                                                          COOPERATIVA AGRARIA CAFETALERA DIVISORIA
                                    4
                                              20352423921                 LTDA                                                                                   1,790,327.87
                                                                          ASOCIACION DE PRODUCTORES "CACAO ALTO
                                    5
                                              20528976612                 HU                                                                                        490,180.70
                                    6         20502435672                 SILVATEAM PERU S.A.C.                                                                     206,640.00
                                    7         20502893972                 KING LUMBER COMPANY S.A.C.                                                                161,706.20
                                    8         20528919813                 SEMIFOR E.I.R.L.                                                                             98,773.55
                                                                          MOLINOS ASOCIADOS SOCIEDAD ANONIMA
                                    9
                                              20515919768                 CERRADA                                                                                      77,208.21
                                   10         20120705866                 TODO AGRICOLA S.A.                                                                           56,984.00
                                   11         20528943871                 GRUPO KAMPOFLOR S.A.C.                                                                       45,879.00
                                   12         20393556715                 CRUZERO IMPORT EXPORT S.A.C.                                                                 20,339.00
                                                                          EXOTIC FLOWERS SOCIEDAD ANONIMA CERRA-
                                   13
                                              20489682100                 DA                                                                                           20,283.75
                                   14         20489308160                 SHIMAKU MEDICINALS E.I.R.L.                                                                  11,680.00
                                   15         20489730945                 INVESTIGACION BIOTECNOLOGICA DE LA SELVA                                                     10,800.33
                                                                          EXPORTACIONES AMAZONICAS NATIVAS
                                   16
                                              20330070278                 SRLTDA.                                                                                        6,857.69
                                   17         20517519902                 CORPORACION INDUSTRIAL DEL NORTE SAC                                                           6,492.75
                                                                          EMPRESA PRODUCTORA AGRICOLA ASUNCION
                                   18
                                              20528917365                 S.R                                                                                            3,465.00

                                                    Total                                                                                                      36,318,504.94


Número de Empresas Exportadoras                             Contribución de las Exportaciones de la Región Huánuco del Total de Exportaciones del Perú
(según tamaño)
                                                                                 Exportaciones Tradicionales (*) 2010                                         Exportaciones No Tradicionales (**) 2010
                                                                                       (% según Millones USD)                                                         (% según Millones USD)


                        2
                     Grandes                                                       Resto
                                                                                    del                                                                        Resto
                                                                                                                                                              del Perú
                       2                                                           Perú                                                                       99.86%
                    Medianas                                                      99.91%
                                        PYMES
                                        22.22 %
                       2
                    Pequeñas
                                                                                                                          Huanuco                                                                             Huanuco
                        12                                                                                                 0.09%                                                                               0.14%
                       Micro

              Total: 18 Empresas
                                                                                                                                              Nota: (**) Sectores; Agropecuario, Textil, Químico, Sidero Metalúrgico, Pesquero,
                                                                 Nota: (*) Sectores; Minería, Petróleo y Gas Natural, Pesquero y Agrícola.    Metal Mecánico, Madera, Minería No Metálica, Joyería, Cuero y Artesanía.


                                                                         OFICINAS DESCONCENTRADAS DE PROMPERU-EXPORTACIONES

             - Piura - Macro Región Norte: (073) 320249                                    - Junín - Macro Región Centro: (064) 203400                        - Cusco - Macro Región Sureste: (084) 223592; 223611
    - Lambayeque - Macro Región Noroeste: (074) 274330; 228881                     - Arequipa - Macro Región Suroeste: (054) 281535; 288447                   - Loreto - Macro Región Oriente: (065) 221703; 232833

Más contenido relacionado

Similar a Pedro Espino Vargas - ficha regional huanuco

Pedro Espino Vargas - ficha regional cusco
Pedro Espino Vargas - ficha regional cuscoPedro Espino Vargas - ficha regional cusco
Pedro Espino Vargas - ficha regional cuscoDr. Pedro Espino Vargas
 
Pedro Espino Vargas - Ficha Regional cajamarca
Pedro Espino Vargas - Ficha Regional  cajamarcaPedro Espino Vargas - Ficha Regional  cajamarca
Pedro Espino Vargas - Ficha Regional cajamarcaDr. Pedro Espino Vargas
 
Pedro Espino Vargas - Ficha regional junin
Pedro Espino Vargas - Ficha regional juninPedro Espino Vargas - Ficha regional junin
Pedro Espino Vargas - Ficha regional juninDr. Pedro Espino Vargas
 
Pedro Espino Vargas - ficha regional de loreto
Pedro Espino Vargas - ficha regional de  loretoPedro Espino Vargas - ficha regional de  loreto
Pedro Espino Vargas - ficha regional de loretoDr. Pedro Espino Vargas
 
Pedro Espino Vargas - ficha regional de tacna
Pedro Espino Vargas - ficha regional de  tacnaPedro Espino Vargas - ficha regional de  tacna
Pedro Espino Vargas - ficha regional de tacnaDr. Pedro Espino Vargas
 
Pedro Espino Vargas - ficha regional ucayali
Pedro Espino Vargas - ficha regional ucayaliPedro Espino Vargas - ficha regional ucayali
Pedro Espino Vargas - ficha regional ucayaliDr. Pedro Espino Vargas
 
Pedro Espino vargas - ficha regional de piura
Pedro Espino vargas - ficha regional de piuraPedro Espino vargas - ficha regional de piura
Pedro Espino vargas - ficha regional de piuraDr. Pedro Espino Vargas
 
Pedro Espino Vargas - ficha regional de moquegua
Pedro Espino Vargas - ficha regional de moqueguaPedro Espino Vargas - ficha regional de moquegua
Pedro Espino Vargas - ficha regional de moqueguaDr. Pedro Espino Vargas
 
Pedro Espino Vargas - ficha regional de madre_de_dios
Pedro Espino Vargas - ficha regional de madre_de_diosPedro Espino Vargas - ficha regional de madre_de_dios
Pedro Espino Vargas - ficha regional de madre_de_diosDr. Pedro Espino Vargas
 
Pedro Espino Vargas - ficha regional de la_libertad
Pedro Espino Vargas - ficha regional de la_libertadPedro Espino Vargas - ficha regional de la_libertad
Pedro Espino Vargas - ficha regional de la_libertadDr. Pedro Espino Vargas
 
Pedro Espino Vargas - ficha regional de san_martin
Pedro Espino Vargas - ficha regional de san_martinPedro Espino Vargas - ficha regional de san_martin
Pedro Espino Vargas - ficha regional de san_martinDr. Pedro Espino Vargas
 
Pedro Espino Vargas - ficha regional ica 2012
Pedro Espino Vargas - ficha regional ica 2012Pedro Espino Vargas - ficha regional ica 2012
Pedro Espino Vargas - ficha regional ica 2012Dr. Pedro Espino Vargas
 
Pedro Espino Vargas - Ficha Region arequipa 2012
Pedro Espino Vargas - Ficha Region arequipa 2012Pedro Espino Vargas - Ficha Region arequipa 2012
Pedro Espino Vargas - Ficha Region arequipa 2012Dr. Pedro Espino Vargas
 
Pedro Espino Vargas - ficha regional de lima
Pedro Espino Vargas - ficha regional de limaPedro Espino Vargas - ficha regional de lima
Pedro Espino Vargas - ficha regional de limaDr. Pedro Espino Vargas
 
Pedro Espino Vargas- Ficha Region ancash 2012
Pedro Espino Vargas- Ficha Region ancash 2012Pedro Espino Vargas- Ficha Region ancash 2012
Pedro Espino Vargas- Ficha Region ancash 2012Dr. Pedro Espino Vargas
 
Pedro Espino Vargas - Ficha Region amazonas
Pedro Espino Vargas - Ficha Region amazonasPedro Espino Vargas - Ficha Region amazonas
Pedro Espino Vargas - Ficha Region amazonasDr. Pedro Espino Vargas
 

Similar a Pedro Espino Vargas - ficha regional huanuco (18)

Pedro Espino Vargas - CUZCO 2012
Pedro Espino Vargas - CUZCO 2012Pedro Espino Vargas - CUZCO 2012
Pedro Espino Vargas - CUZCO 2012
 
Pedro Espino Vargas - ficha regional cusco
Pedro Espino Vargas - ficha regional cuscoPedro Espino Vargas - ficha regional cusco
Pedro Espino Vargas - ficha regional cusco
 
Pedro Espino Vargas - Ficha Regional cajamarca
Pedro Espino Vargas - Ficha Regional  cajamarcaPedro Espino Vargas - Ficha Regional  cajamarca
Pedro Espino Vargas - Ficha Regional cajamarca
 
Pedro Espino Vargas - Ficha regional junin
Pedro Espino Vargas - Ficha regional juninPedro Espino Vargas - Ficha regional junin
Pedro Espino Vargas - Ficha regional junin
 
Pedro Espino Vargas - ficha regional de loreto
Pedro Espino Vargas - ficha regional de  loretoPedro Espino Vargas - ficha regional de  loreto
Pedro Espino Vargas - ficha regional de loreto
 
Pedro Espino Vargas - ficha regional de tacna
Pedro Espino Vargas - ficha regional de  tacnaPedro Espino Vargas - ficha regional de  tacna
Pedro Espino Vargas - ficha regional de tacna
 
Pedro Espino Vargas - ficha regional ucayali
Pedro Espino Vargas - ficha regional ucayaliPedro Espino Vargas - ficha regional ucayali
Pedro Espino Vargas - ficha regional ucayali
 
Pedro Espino vargas - ficha regional de piura
Pedro Espino vargas - ficha regional de piuraPedro Espino vargas - ficha regional de piura
Pedro Espino vargas - ficha regional de piura
 
Pedro Espino Vargas - ficha regional de moquegua
Pedro Espino Vargas - ficha regional de moqueguaPedro Espino Vargas - ficha regional de moquegua
Pedro Espino Vargas - ficha regional de moquegua
 
Pedro Espino Vargas - ficha regional de madre_de_dios
Pedro Espino Vargas - ficha regional de madre_de_diosPedro Espino Vargas - ficha regional de madre_de_dios
Pedro Espino Vargas - ficha regional de madre_de_dios
 
Pedro Espino Vargas - ficha regional de la_libertad
Pedro Espino Vargas - ficha regional de la_libertadPedro Espino Vargas - ficha regional de la_libertad
Pedro Espino Vargas - ficha regional de la_libertad
 
Pedro Espino Vargas - ficha regional de san_martin
Pedro Espino Vargas - ficha regional de san_martinPedro Espino Vargas - ficha regional de san_martin
Pedro Espino Vargas - ficha regional de san_martin
 
Pedro Espino Vargas - ficha regional ica 2012
Pedro Espino Vargas - ficha regional ica 2012Pedro Espino Vargas - ficha regional ica 2012
Pedro Espino Vargas - ficha regional ica 2012
 
Pedro Espino Vargas - Ficha Region arequipa 2012
Pedro Espino Vargas - Ficha Region arequipa 2012Pedro Espino Vargas - Ficha Region arequipa 2012
Pedro Espino Vargas - Ficha Region arequipa 2012
 
Pedro Espino Vargas - ficha regional de lima
Pedro Espino Vargas - ficha regional de limaPedro Espino Vargas - ficha regional de lima
Pedro Espino Vargas - ficha regional de lima
 
Pedro Espino Vargas- Ficha Region ancash 2012
Pedro Espino Vargas- Ficha Region ancash 2012Pedro Espino Vargas- Ficha Region ancash 2012
Pedro Espino Vargas- Ficha Region ancash 2012
 
Pedro Espino Vargas - Ficha Region amazonas
Pedro Espino Vargas - Ficha Region amazonasPedro Espino Vargas - Ficha Region amazonas
Pedro Espino Vargas - Ficha Region amazonas
 
Plan de reconstrucción patrimonial minvu
Plan de reconstrucción patrimonial minvuPlan de reconstrucción patrimonial minvu
Plan de reconstrucción patrimonial minvu
 

Más de Dr. Pedro Espino Vargas (20)

LIBRO INTERNACIONAL COMPETITIVIDAD ,UN CAMINO HACIA EL DESARROLLO EN AMÉRICA...
LIBRO INTERNACIONAL  COMPETITIVIDAD ,UN CAMINO HACIA EL DESARROLLO EN AMÉRICA...LIBRO INTERNACIONAL  COMPETITIVIDAD ,UN CAMINO HACIA EL DESARROLLO EN AMÉRICA...
LIBRO INTERNACIONAL COMPETITIVIDAD ,UN CAMINO HACIA EL DESARROLLO EN AMÉRICA...
 
Marketing y ventas
Marketing y ventasMarketing y ventas
Marketing y ventas
 
Marketing comunicacion
Marketing comunicacionMarketing comunicacion
Marketing comunicacion
 
Marketing promocion
Marketing promocionMarketing promocion
Marketing promocion
 
Marketing precio
Marketing precioMarketing precio
Marketing precio
 
Marketing plaza
Marketing plaza Marketing plaza
Marketing plaza
 
Marketing producto
Marketing producto Marketing producto
Marketing producto
 
Marketing segmentacion
Marketing segmentacion Marketing segmentacion
Marketing segmentacion
 
Marketing negocios
Marketing negocios Marketing negocios
Marketing negocios
 
Plan marketing
Plan marketing Plan marketing
Plan marketing
 
MarkPlan marketing eting consumidor
MarkPlan marketing eting consumidor MarkPlan marketing eting consumidor
MarkPlan marketing eting consumidor
 
Marketing mix
Marketing mix Marketing mix
Marketing mix
 
Marketing
Marketing Marketing
Marketing
 
Mad men in china 2015
Mad men in china 2015Mad men in china 2015
Mad men in china 2015
 
best of slideshare 2014
 best of slideshare 2014 best of slideshare 2014
best of slideshare 2014
 
personal branding 2015
personal branding 2015personal branding 2015
personal branding 2015
 
Google the future
Google the futureGoogle the future
Google the future
 
Visual merchandising
Visual merchandisingVisual merchandising
Visual merchandising
 
shopper marketing
 shopper marketing  shopper marketing
shopper marketing
 
prospectiva económica de peru 2015 2017
prospectiva económica de peru 2015 2017prospectiva económica de peru 2015 2017
prospectiva económica de peru 2015 2017
 

Pedro Espino Vargas - ficha regional huanuco

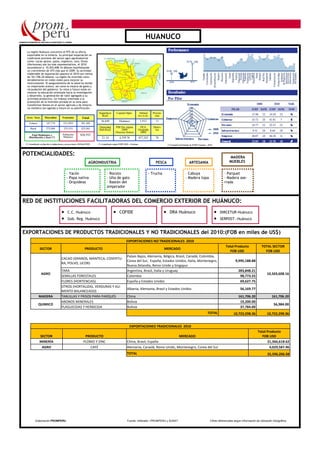
  • 1. HUANUCO La región Huánuco concentra el 97% de su oferta exportable en la minería. Su principal exportación no tradicional proviene del sector agro-agroindustrial como: cacao (grano, pasta, orgánico), tara, flores (Hortensias) son los más representativos, el 2010 ascendieron a 10,503,608.16 dólares manifestando un crecimiento de 47% más que el 2009. Su actividad maderable de exportación aparece el 2010 con ventas de 161,706.20 dólares. La región ha invertido consi- derablemente en redes viales para mejorar su interconexión. El aseguramiento de la salud ha tenido un importante avance, así como la mejora de gasto y recaudación del gobierno. Su retos a futuro están en mejorar la educación orientada hacia la investigación y desarrollo, la generación de valor agregado a su actividad productiva. Un trabajo orientado a la promoción de la inversión privada en la zona para transformar bienes en el sector agrícola y de minería no metálica son agenda a futuro en su planificación. Superficie Capital Dpto. Altitud Provin- Km2 m.s.n.m. cias Area / Sexo Masculino Femenino Total 36,849 Huánuco 1,912 11 Urbano 147,774 153,5955 301,369 Rural 272,044 253,519 525,563 Densidad PBI Per cápita PEA Distri- Hab/Km2 2009 Ocupada tos (Nuevos Soles) 2009 Total Habitantes y Población 826,932 Distribución x Sexo (*) Huánuco 21.14 4,359.76 457,342 76 (*) Actualizado en función a estimaciones y proyecciones 2010 del INEI (*) Actualizado según ICRP 2010—Centrum (*) Extraído del Estudio de ICRP Centrum—2010 POTENCIALIDADES: MADERA AGROINDUSTRIA PESCA ARTESANIA MUEBLES - Yacón - Rocoto - Trucha - Cabuya - Parquet - Papa nativa - Uña de gato - Madera topa - Madera ase- - Orquídeas - Bastón del rrada emperador RED DE INSTITUCIONES FACILITADORAS DEL COMERCIO EXTERIOR DE HUÁNUCO: C.C. Huánuco COFIDE DRA Huánuco DIRCETUR-Huánuco Gob. Reg. Huánuco SERPOST—Huánuco EXPORTACIONES DE PRODUCTOS TRADICIONALES Y NO TRADICIONALES del 2010:(FOB en miles de US$) EXPORTACIONES NO TRADICIONALES 2010 Total Producto TOTAL SECTOR SECTOR PRODUCTO MERCADO FOB USD FOB USD Países Bajos, Alemania, Bélgica, Brasil, Canadá, Colombia, CACAO (GRANOS, MANTECA, COVERTU- Corea del Sur, España, Estados Unidos, Italia, Montenegro, 9,995,188.88 RA, POLVO, LICOR) Nueva Zelandia, Reino Unido y Singapur TARA Argentina, Brasil, Italia y Uruguay 283,848.21 AGRO 10,503,608.16 SEMILLAS FORESTALES Colombia 98,773.55 FLORES (HORTENCIAS) España y Estados Unidos 69,627.75 OTROS (HORTALIZAS, VERDURAS Y ALI- Albania, Alemania, Brasil y Estados Unidos 56,169.77 MENTO BALANCEADO) MADERA TABLILLAS Y FRISOS PARA PARQUÉS China 161,706.20 161,706.20 ABONOS MINERALES Bolivia 19,200.00 QUIMICO 56,984.00 PLAGUICIDAS Y HERBICIDA Bolivia 37,784.00 TOTAL 10,722,298.36 10,722,298.36 EXPORTACIONES TRADICIONALES 2010 Total Producto SECTOR PRODUCTO MERCADO FOB USD MINERÍA PLOMO Y ZINC China, Brasil, España 21,566,618.62 AGRO CAFÉ Alemania, Canadá, Reino Unido, Montenegro, Corea del Sur 4,029,587.96 TOTAL 25,596,206.58 Elaboración PROMPERU Fuente: Infotrade—PROMPERU y SUNAT Cifras referenciales según información de Ubicación Geográfica
  • 2. HUANUCO PRINCIPALES EMPRESAS EXPORTADORAS DE LA REGION HUÁNUCO (FOB en US$) 2010 N° RUC EMPRESA FOB USD 1 20100163552 CIA MINERA RAURA S A 17,038,152.79 2 20136264053 COOPERATIVA AGRARIA INDUSTRIAL NARANJILL 11,744,268.27 3 20259150117 AYS S.A. 4,528,465.83 COOPERATIVA AGRARIA CAFETALERA DIVISORIA 4 20352423921 LTDA 1,790,327.87 ASOCIACION DE PRODUCTORES "CACAO ALTO 5 20528976612 HU 490,180.70 6 20502435672 SILVATEAM PERU S.A.C. 206,640.00 7 20502893972 KING LUMBER COMPANY S.A.C. 161,706.20 8 20528919813 SEMIFOR E.I.R.L. 98,773.55 MOLINOS ASOCIADOS SOCIEDAD ANONIMA 9 20515919768 CERRADA 77,208.21 10 20120705866 TODO AGRICOLA S.A. 56,984.00 11 20528943871 GRUPO KAMPOFLOR S.A.C. 45,879.00 12 20393556715 CRUZERO IMPORT EXPORT S.A.C. 20,339.00 EXOTIC FLOWERS SOCIEDAD ANONIMA CERRA- 13 20489682100 DA 20,283.75 14 20489308160 SHIMAKU MEDICINALS E.I.R.L. 11,680.00 15 20489730945 INVESTIGACION BIOTECNOLOGICA DE LA SELVA 10,800.33 EXPORTACIONES AMAZONICAS NATIVAS 16 20330070278 SRLTDA. 6,857.69 17 20517519902 CORPORACION INDUSTRIAL DEL NORTE SAC 6,492.75 EMPRESA PRODUCTORA AGRICOLA ASUNCION 18 20528917365 S.R 3,465.00 Total 36,318,504.94 Número de Empresas Exportadoras Contribución de las Exportaciones de la Región Huánuco del Total de Exportaciones del Perú (según tamaño) Exportaciones Tradicionales (*) 2010 Exportaciones No Tradicionales (**) 2010 (% según Millones USD) (% según Millones USD) 2 Grandes Resto del Resto del Perú 2 Perú 99.86% Medianas 99.91% PYMES 22.22 % 2 Pequeñas Huanuco Huanuco 12 0.09% 0.14% Micro Total: 18 Empresas Nota: (**) Sectores; Agropecuario, Textil, Químico, Sidero Metalúrgico, Pesquero, Nota: (*) Sectores; Minería, Petróleo y Gas Natural, Pesquero y Agrícola. Metal Mecánico, Madera, Minería No Metálica, Joyería, Cuero y Artesanía. OFICINAS DESCONCENTRADAS DE PROMPERU-EXPORTACIONES - Piura - Macro Región Norte: (073) 320249 - Junín - Macro Región Centro: (064) 203400 - Cusco - Macro Región Sureste: (084) 223592; 223611 - Lambayeque - Macro Región Noroeste: (074) 274330; 228881 - Arequipa - Macro Región Suroeste: (054) 281535; 288447 - Loreto - Macro Región Oriente: (065) 221703; 232833