
Recomendados
Más contenido relacionado
Similar a Equilibrio
Similar a Equilibrio (10)
Último
Último (17)
Equilibrio
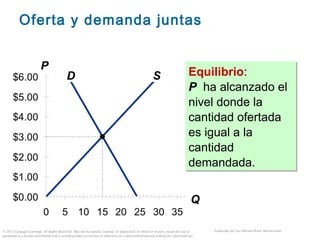
- 1. © 2012 Cengage Learning. All Rights Reserved. May not be copied, scanned, or duplicated, in whole or in part, except for use as permitted in a license distributed with a certain product or service or otherwise on a password-protected website for classroom use. 11 $0.00 $1.00 $2.00 $3.00 $4.00 $5.00 $6.00 0 5 10 15 20 25 30 35 P Q Oferta y demanda juntas D S Equilibrio: P ha alcanzado el nivel donde la cantidad ofertada es igual a la cantidad demandada. Equilibrio: P ha alcanzado el nivel donde la cantidad ofertada es igual a la cantidad demandada. Traducido por Luz Marina Bruce Marticorena
- 2. © 2012 Cengage Learning. All Rights Reserved. May not be copied, scanned, or duplicated, in whole or in part, except for use as permitted in a license distributed with a certain product or service or otherwise on a password-protected website for classroom use. 22 D S $0.00 $1.00 $2.00 $3.00 $4.00 $5.00 $6.00 0 5 10 15 20 25 30 35 P Q Precio de equilibrio: P QD QS $0 24 0 1 21 5 2 18 10 3 15 15 4 12 20 5 9 25 6 6 30 el precio que iguala la cantidad ofertada con la cantidad demandada. Traducido por Luz Marina Bruce Marticorena
- 3. © 2012 Cengage Learning. All Rights Reserved. May not be copied, scanned, or duplicated, in whole or in part, except for use as permitted in a license distributed with a certain product or service or otherwise on a password-protected website for classroom use. 33 D S $0.00 $1.00 $2.00 $3.00 $4.00 $5.00 $6.00 0 5 10 15 20 25 30 35 P Q Cantidad de equilibrio: P QD QS $0 24 0 1 21 5 2 18 10 3 15 15 4 12 20 5 9 25 6 6 30 la cantidad ofertada y la cantidad demandada al precio de equilibrio Traducido por Luz Marina Bruce Marticorena
- 4. © 2012 Cengage Learning. All Rights Reserved. May not be copied, scanned, or duplicated, in whole or in part, except for use as permitted in a license distributed with a certain product or service or otherwise on a password-protected website for classroom use. 44 $0.00 $1.00 $2.00 $3.00 $4.00 $5.00 $6.00 0 5 10 15 20 25 30 35 P Q D S Sobreproducción (exceso de oferta):cuando la cantidad ofertada es mayor que la cantidad demandada Exceso Ejemplo: Si P = $5, entonces QD = 9 lattes y QS = 25 lattes que resulta en un exceso de 16 lattes Traducido por Luz Marina Bruce Marticorena
- 5. © 2012 Cengage Learning. All Rights Reserved. May not be copied, scanned, or duplicated, in whole or in part, except for use as permitted in a license distributed with a certain product or service or otherwise on a password-protected website for classroom use. 55 $0.00 $1.00 $2.00 $3.00 $4.00 $5.00 $6.00 0 5 10 15 20 25 30 35 P Q D S Sobreproducción (exceso de oferta):cuando la cantidad ofertada es mayor que la cantidad demandada Frente a un exceso los vendedores intentarán aumentar las ventas bajando el precio Esto causa que QD aumente Exceso …lo que reduce el exceso. y QS baje… Traducido por Luz Marina Bruce Marticorena
- 6. © 2012 Cengage Learning. All Rights Reserved. May not be copied, scanned, or duplicated, in whole or in part, except for use as permitted in a license distributed with a certain product or service or otherwise on a password-protected website for classroom use. 66 $0.00 $1.00 $2.00 $3.00 $4.00 $5.00 $6.00 0 5 10 15 20 25 30 35 P Q D S Sobreproducción (exceso de oferta):cuando la cantidad ofertada es mayor que la cantidad demandada Frente a un exceso los vendedores intentarán aumentar las ventas bajando el precio. , Esto causa que QD aumente y QS baje… Exceso Los precios seguirán bajando hasta que el mercado alcance el equilibrio. Traducido por Luz Marina Bruce Marticorena
- 7. © 2012 Cengage Learning. All Rights Reserved. May not be copied, scanned, or duplicated, in whole or in part, except for use as permitted in a license distributed with a certain product or service or otherwise on a password-protected website for classroom use. 77 $0.00 $1.00 $2.00 $3.00 $4.00 $5.00 $6.00 0 5 10 15 20 25 30 35 P Q D S Escasez (exceso de demanda): cuando la cantidad demandada es mayor que la cantidad ofertada Ejemplo: Si P = $1, entonces QD = 21 lattes y QS = 5 lattes lo que resulta en una escasez de 16 lattesEscasez Traducido por Luz Marina Bruce Marticorena
- 8. © 2012 Cengage Learning. All Rights Reserved. May not be copied, scanned, or duplicated, in whole or in part, except for use as permitted in a license distributed with a certain product or service or otherwise on a password-protected website for classroom use. 88 $0.00 $1.00 $2.00 $3.00 $4.00 $5.00 $6.00 0 5 10 15 20 25 30 35 P Q D S Escasez (exceso de demanda): cuando la cantidad demandada es mayor que la cantidad ofertada Frente a una escasez los vendedores aumentan el precio que causa que QD baje …lo que reduce la escasez y QS aumente, Escasez Traducido por Luz Marina Bruce Marticorena
- 9. © 2012 Cengage Learning. All Rights Reserved. May not be copied, scanned, or duplicated, in whole or in part, except for use as permitted in a license distributed with a certain product or service or otherwise on a password-protected website for classroom use. 99 $0.00 $1.00 $2.00 $3.00 $4.00 $5.00 $6.00 0 5 10 15 20 25 30 35 P Q D S Escasez (exceso de demanda): cuando la cantidad demandada es mayor que la cantidad ofertada Frente a una escasez los vendedores aumentan el precio, que causa que QD baje y QS aumente. Escasez Los precios seguirán aumentando hasta que el mercado alcance el equilibrio. Traducido por Luz Marina Bruce Marticorena
- 10. © 2012 Cengage Learning. All Rights Reserved. May not be copied, scanned, or duplicated, in whole or in part, except for use as permitted in a license distributed with a certain product or service or otherwise on a password-protected website for classroom use. 1010 Tres pasos para analizar cambios en el equilibrio Para averiguar los efectos de cualquier situación 1. Decida si el evento desplaza la oferta, la demanda o ambas. 2. Decida en qué dirección se desplaza. 3. Use un gráfico oferta-demanda para ver los cambios en el precio y la cantidad de equilibrio. Para averiguar los efectos de cualquier situación 1. Decida si el evento desplaza la oferta, la demanda o ambas. 2. Decida en qué dirección se desplaza. 3. Use un gráfico oferta-demanda para ver los cambios en el precio y la cantidad de equilibrio. Traducido por Luz Marina Bruce Marticorena
- 11. © 2012 Cengage Learning. All Rights Reserved. May not be copied, scanned, or duplicated, in whole or in part, except for use as permitted in a license distributed with a certain product or service or otherwise on a password-protected website for classroom use. 1111 Desplazamiento y movimiento a lo largo de la curva Cambio en la oferta: un desplazamiento de la curva de oferta ocurre cuando cambia un determinante de la oferta distinto al precio (como la tecnología o los costos) Cambio en la cantidad ofertada: un movimiento a lo largo de la curva de oferta ocurre cuando cambia el precio Cambio en la demanda: un desplazamiento de la curva de demanda ocurre cuando cambia un determinante de la demanda distinto al precio (como el ingreso o el número de vendedores) Cambio en la cantidad demandada: un movimiento a lo largo de la curva de demanda ocurre cuando cambia el precio Traducido por Luz Marina Bruce Marticorena
- 12. © 2012 Cengage Learning. All Rights Reserved. May not be copied, scanned, or duplicated, in whole or in part, except for use as permitted in a license distributed with a certain product or service or otherwise on a password-protected website for classroom use. 1212 CONCLUSIÓN: Cómo los precios asignan recursos En las economías de mercado, los precios cambian para equilibrar la oferta y la demanda. Los precios de equilibrio son señales que guían las decisiones económicas y así asignan los recursos escasos. Traducido por Luz Marina Bruce Marticorena
Notas del editor
- We now return to the latte example to illustrate the concepts of equilibrium: shortage and surplus.
- Step 1 requires knowing all of the things that can shift D and S—the non-price determinants of demand and of supply.
- “Supply” refers to the position of the supply curve, while “quantity supplied” refers to the specific amount that producers are willing and able to sell. Similarly, “demand” refers to the position of the demand curve, while “quantity demanded” refers to the specific amount that consumers are willing and able to buy. If you’d like to be a rebel, delete this slide and all references to the jargon it contains, and just use the terms “movement along a curve” and “shift in a curve.” Note, however, that this is not the official recommendation of Cengage/South-Western or Dr. Mankiw. If you’d like to cover this slide but make it move more quickly, delete the text next to each second-level bullet (starting with “occurs when”). Instead, give the information to your students verbally or rely on them to read it in the textbook.
- In the textbook, the conclusion of this chapter offers some very nice elaboration on the second bullet point. There is also an “In the News” box with a very nice article titled “In Praise of Price Gouging.”