Evolución de los trabajadores autónomos menores de 30 años en la UE y España según Eurostat
•
0 recomendaciones•170 vistas

The document summarizes statistics from Eurostat on the number of self-employed workers under 30 years old in Europe and Spain from 2009 to 2011. In Europe, the number of self-employed young workers decreased from 2009 to 2010 but increased from 2010 to 2011. In Spain, the number decreased each year from 2009 to 2011, with the largest decreases between 2009 and 2010.
Recomendados

Recomendados
Más contenido relacionado
Más de econred
Más de econred (20)
Último
Último (20)
Evolución de los trabajadores autónomos menores de 30 años en la UE y España según Eurostat
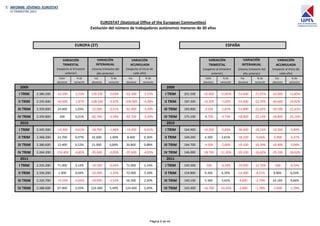
- 1. EUROSTAT (Statistical Office of the European Communities) Evolución del número de trabajadores autónomos menores de 30 años EUROPA (27) ESPAÑA VARIACIÓN VARIACIÓN VARIACIÓN VARIACIÓN VARIACIÓN VARIACIÓN TRIMESTAL INTERANUAL ACUMULADA TRIMESTAL INTERANUAL ACUMULADA (respecto al trimestre (mismo trimestre del (respecto al inicio de (respecto al trimestre (mismo trimestre del (respecto al inicio de anterior) año anterior) cada año) anterior) año anterior) cada año) Valor % de Var. % de Var. % de Valor % de Var. % de Var. % de absoluto variación absoluta variación absoluta variación absoluto variación absoluta variación absoluta variación 2009 2009 I TRIM 2.380.200 -62.300 -2,55% -126.100 -5,03% -62.300 -2,55% I TRIM 201.500 -32.400 -13,85% -53.600 -21,01% -32.400 -13,85% II TRIM 2.335.600 -44.600 -1,87% -108.200 -4,43% -106.900 -4,38% II TRIM 187.300 -14.200 -7,05% -53.900 -22,35% -46.600 -19,92% III TRIM 2.359.600 24.000 1,03% -12.000 -0,51% -82.900 -3,39% III TRIM 183.800 -3.500 -1,87% -53.800 -22,64% -50.100 -21,42% IV TRIM 2.359.800 200 0,01% -82.700 -3,39% -82.700 -3,39% IV TRIM 175.100 -8.700 -4,73% -58.800 -25,14% -58.800 -25,14% 2010 2010 I TRIM 2.345.500 -14.300 -0,61% -34.700 -1,46% -14.300 -0,61% I TRIM 164.900 -10.200 -5,83% -36.600 -18,16% -10.200 -5,83% II TRIM 2.368.200 22.700 0,97% 32.600 1,40% 8.400 0,36% II TRIM 169.200 4.300 2,61% -18.100 -9,66% -5.900 -3,37% III TRIM 2.380.600 12.400 0,52% 21.000 0,89% 20.800 0,88% III TRIM 164.700 -4.500 -2,66% -19.100 -10,39% -10.400 -5,94% IV TRIM 2.264.200 -116.400 -4,89% -95.600 -4,05% -95.600 -4,05% IV TRIM 146.000 -18.700 -11,35% -29.100 -16,62% -29.100 -16,62% 2011 2011 I TRIM 2.335.200 71.000 3,14% -10.300 -0,44% 71.000 3,14% I TRIM 145.500 -500 -0,34% -19.400 -11,76% -500 -0,34% II TRIM 2.336.200 1.000 0,04% -32.000 -1,35% 72.000 3,18% II TRIM 154.800 9.300 6,39% -14.400 -8,51% 8.800 6,03% III TRIM 2.320.700 -15.500 -0,66% -59.900 -2,52% 56.500 2,50% III TRIM 160.100 5.300 3,42% -4.600 -2,79% 14.100 9,66% IV TRIM 2.388.600 67.900 2,93% 124.400 5,49% 124.400 5,49% IV TRIM 143.400 -16.700 -10,43% -2.600 -1,78% -2.600 -1,78% Página 6 de 44