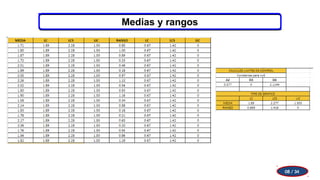
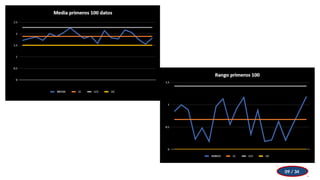
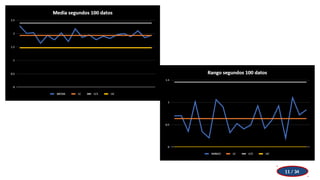
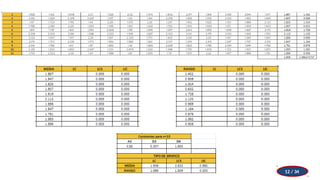
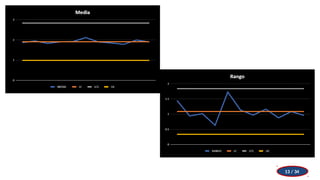
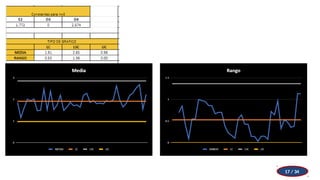
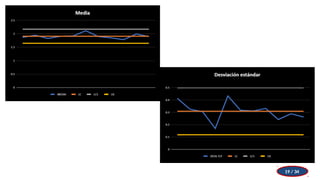
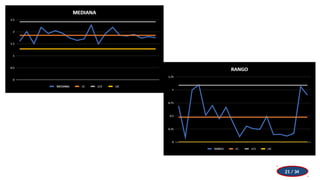
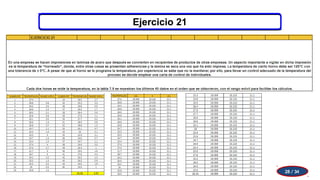
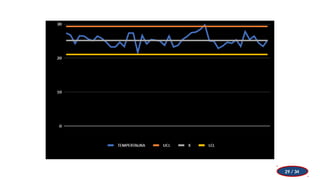
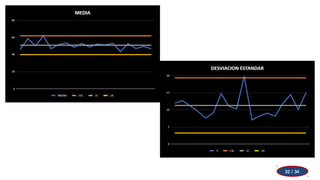
Uses control charts for process stability.
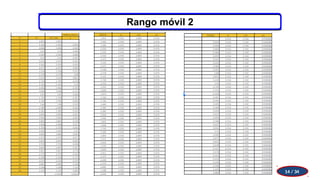
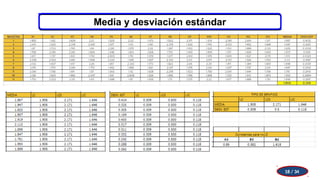
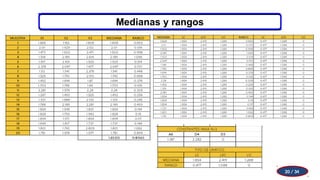
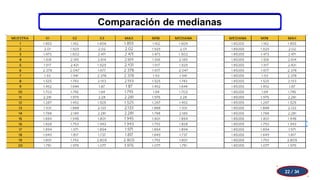
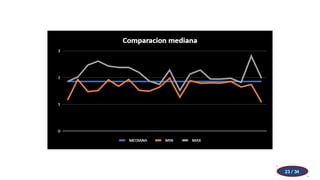
Charts track means, ranges, and standard deviations.
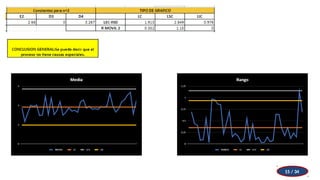
Distinguishes between common and special cause variation.
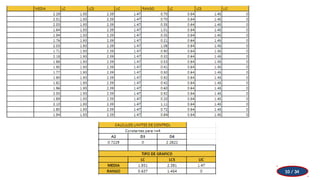
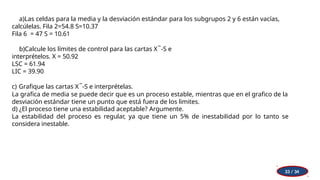
A process is stable if data is within control limits.
Control limits are calculated as mean ± 3 standard deviations.
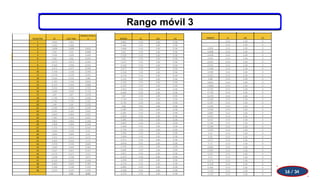
Different charts (X̅-R, X̅-S, I-MR) for different applications.
Pre-control is used for startup, not for poor capability processes.


![Unidad1[1]](https://cdn.slidesharecdn.com/ss_thumbnails/unidad11-100905231554-phpapp02-thumbnail.jpg?width=640&height=640&fit=bounds)


