Propiedades mecánicas de materiales-No realizada por mateo guerrero melo
•Descargar como PPT, PDF•
1 recomendación•1,268 vistas

Propiedades mecánicas, no relaizada por mateo guerrero melo, encontrada en internet sin titulo ni nombre de realizador, no se atribuye a guerrero como creador de la presentacion de propiedades mecánicas.

Recomendados
Más contenido relacionado
La actualidad más candente
La actualidad más candente (20)
Destacado
Destacado (20)
Similar a Propiedades mecánicas de materiales-No realizada por mateo guerrero melo
Similar a Propiedades mecánicas de materiales-No realizada por mateo guerrero melo (20)
Último
Último (20)
Propiedades mecánicas de materiales-No realizada por mateo guerrero melo
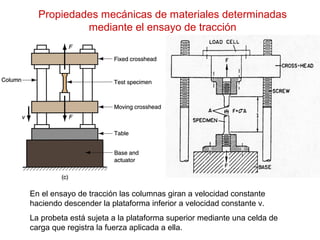
- 1. Propiedades mecánicas de materiales determinadas mediante el ensayo de tracción En el ensayo de tracción las columnas giran a velocidad constante haciendo descender la plataforma inferior a velocidad constante v. La probeta está sujeta a la plataforma superior mediante una celda de carga que registra la fuerza aplicada a ella.
- 2. Mordazas
- 3. Celdas de Carga Extensómetro
- 4. Tensión (S) y deformación (e) de Ingeniería Engineering stress: S = F/A Original area 0 Engineering strain: e = L - L o o L
- 5. Curva tensión (S) – deformación (e) de Ingeniería Tensile stress – strain curve UTS MPa
- 6. Curva tensión – deformación verdaderas
- 7. Definiciones – Yield strength (Y) • Stress at which plastic deformation starts to occur – Young’s modulus (E) S = E·e • The slope of the linear elastic part of the curve – Ultimate tensile strength (UTS) UTS Max Load • Maximum engineering stress • Stress at which necking or strain localization occurs – 2% Offset yield strength Y(0.002) A O =
- 8. – Tension test sequence Figure 3.2 Typical progress of a tensile test: (1) beginning of test, no load; (2) uniform elongation and reduction of cross‑sectional area; (3) continued elongation, maximum load reached; (4) necking begins, load begins to decrease; and (5) fracture. If pieces are put back together as in (6), final length can be measured.
- 9. Note: In this figure, length is denoted by lower case l. Figure 2.2 (a) Original and final shape of a standard tensile-test specimen. (b) Outline of a tensile-test sequence showing stages in the elongation of the specimen.
- 10. Ductilidad – Ductility: Measure of the amount of plastic deformation a material can take before it fractures. • % Elongation to Fracture: L - L % El f O x 100 L O = – % El is affected by specimen gage length. Short specimens show larger % El • % Reduction in Area A = A - A x % O F 100 r A O – No specimen size effect when area in necked region is used
- 11. Typical mechanical properties a temperatura ambiente METALS (WROUGHT) E (GPa) Y (MPa) UTS (MPa) ELONGATION (%) in 50 mm POISSON’S RATIO (n) Aluminum and its alloys Copper and its alloys Lead and its alloys Magnesium and its alloys Molybdenum and its alloys Nickel and its alloys Steels Stainless steels Titanium and its alloys Tungsten and its alloys 69-79 105-150 14 41-45 330-360 180-214 190-200 190-200 80-130 350-400 35-550 76-1100 14 130-305 80-2070 105-1200 205-1725 240-480 344-1380 550-690 90-600 140-1310 20-55 240-380 90-2340 345-1450 415-1750 480-760 415-1450 620-760 45-5 65-3 50-9 21-5 40-30 60-5 65-2 60-20 25-7 0 0.31-0.34 0.33-0.35 0.43 0.29-0.35 0.32 0.31 0.28-0.33 0.28-0.30 0.31-0.34 0.27 NONMETALLIC MATERIALS Ceramics Diamond Glass and porcelain Rubbers Thermoplastics Thermoplastics, reinforced Thermosets Boron fiber Carbon fibers Glass fibers (S, E) Kevlar fibers (29, 49, 129) Spectra fibers (900, 1000) 70-1000 820-1050 70-80 0.01-0.1 1.4-3.4 2-50 3.5-17 380 275-415 73-85 70-113 73-100 - - - - - - - - - - - - 140-2600 - 140 - 7-80 20-120 35-170 3500 2000-5300 3500-4600 3000-3400 2400-2800 0 - 0 - 1000-5 10-1 0 0 1-2 5 3-4 3 0.2 - 0.24 0.5 0.32-0.40 - 0.34 - - - - - Note: In the upper table the lowest values for E, Y, and UTS and the highest values for elongation are for the pure metals. Multiply GPa by 145,000 to obtain psi, and MPa by 145 to obtain psi. For example, 100 GPa = 14,500 ksi, and 100 MPa = 14,500 psi.
- 12. Tensión(σ) y deformación verdadera (ε) True stress: F A s = True strain: Instantaneous area L dL L L L è ø ò = = ln ç ¸ d = dL L æ ö L O o e e Fig. 3.1 M. P. Groover, “Fundamentals of Modern Manufacturing 3/e” John Wiley, 2007
- 13. True Stress (σ) & Strain (ε) • More Accurate Measurement • True Stress = Force = • True Strain P 0 A l 0 l A P x y P A Ins tan tan eous Area s D l 0 ö çè ÷ø D ö çè æ = ÷ø A ö çè æ = ÷ø ö = æ ÷ ÷ø ç çè æ e = ln ln ln 2ln D D A l 2 0 0 0
- 14. Comparación deformación de ingeniería y verdadera
- 15. Engineering Stress (S) /Strain (e) vs. True Stress (σ) /Strain (ε) True Stress & Engineering Stress (Up to necking) S( e) l l P = · A ö çè 0 0 0 0 ÷ø æ D + = ÷ ÷ø ö S l 1 1 l P A l P = = A æ æ + D l l S l l ö + = ÷ ÷ø ç çè ç çè s = 0 0 0 True Strain & Engineering Strain (Up to necking) æ + D = ln = ln ln 1 l = + ÷ ÷ø ( e) l l l l ö ç çè 0 0 0 e Conservación de volumen: A·l = A0·l0
- 16. Relación entre deformación de Ingeniería y Deformación Verdadera
- 17. Relación tensión verdadera y tensión de ingeniería S S S S Seng = σtrue·exp (- ε) ; σtrue = S·exp (ε)
- 18. Comparación curvas tensión – deformación de ingeniería y verdadera e a la tensión máxima (UTS) ε a la tensión máxima (UTS) Trazo negro, la deformación se mide con el área del cuello
- 20. True Stress-Strain Curve • Constitutive Eq. (plastic range) • K :strength coefficient s = Ke n (true stress at unit true strain) • n :strain hardening exponent • ( coeficiente de endurecimiento • por deformación) logs = log K + nloge Logs loge log K n 1 True Eng. s e f e
- 21. Papel gráfico Log-Log Módulos cuadrados. La escala progresa en múltiplos de 10. El origen puede ser elegido. 10x 10x+1 10x+2 10x+3 10x+4 10y+4 10y+3 10y+2 10y+1 10x
- 22. Typical Values for K and n at Room Temperature σ = K·εn
- 23. Coeficiente de endurecimiento por deformación (n) • Se puede demostrar fácilmente que la deformación verdadera εFmax cuando se llega a la carga máxima es igual a n. • F = σ·A • dF= dσ·dA+A·dσ=0 Condición carga máxima • dσ/σ = - dA/A = dl/L= dε (conservación de volumen) • dσ/dε =σ Si σ = K·εn • n·K·εn-1 = K·εn Se llega a n= ε • Por tanto el valor de n sirve para estimar la magnitud de la deformación a la carga máxima y consecuentemente la deformación homogénea que se puede aplicar a un material.
- 24. Typical values of K and n (σ = K·εn)
- 26. Transición elasto-plástica • El comportamiento elástico termina cuando comienza a producirse deformación plástica, la que ocurre por desplazamiento de dislocaciones (irreversible) • La tensión de fluencia o límite elástico señala el inicio perceptible de la deformación plástica. • En algunos metales (Cu, Al, etc) es difícil determinar la tesnión de fluencia, por tanto convencionalmente se define ésta como el nivel de tensión desde el cual, descargando elásticamente, queda una deformación plástica de 0,2% (0,002)
- 27. Comportamiento plástico Valores típicos de n a temperatura ambiente: acero= 0,01 Cobre = 0,005 Aluminio ≈ 0
- 28. Tensión de fluencia o límite elástico al subir la temperatura • La tensión de fluencia se reduce al subir la temperatura, por esto un material en caliente ofrece menos resistencia a la deformación plástica • La tensión de fluencia de un acero de 0,15%C, a 25ºC es 500 Mpa, a 220ºC es 400MPa y a 600ºC es 200MPa
- 29. A alta temperatura el nivel de la curva σ – ε sube si sube dε/dt. Por tanto la resistencia a la deformación plástica a alta temperatura depende de la velocidad de deformación dε/dt.
- 30. Coeficiente de sensibilidad a la velocidad de deformación (m)
- 31. At “high” temperature strain rate is important, but strain hardening is not so important To calculate the flow stress at “high” (T/TM>0.5) temperature we will use: s = Ce&m At “low” temperature strain hardening is important, but strain rate is not so important To calculate the flow stress at “low” (T/TM<0.5) temperature we will use: s = Ke n