Modelos vehículos más matriculados Colombia 2017
•
0 recomendaciones•431 vistas

El resumen analiza los modelos de vehículos más matriculados en Colombia en febrero de 2017. Los vehículos familiares representaron el 87,1% de las matriculaciones totales, siendo los automóviles el segmento más grande con el 54%. Los 10 modelos más populares fueron el Chevrolet Spark, Chevrolet Sail, Kia Picanto, Renault Logan y otros. Renault y Chevrolet dominaron las ventas de automóviles.

Recomendados
Recomendados
Más contenido relacionado
La actualidad más candente
La actualidad más candente (20)
Destacado
Destacado (20)
Similar a Modelos vehículos más matriculados Colombia 2017
Similar a Modelos vehículos más matriculados Colombia 2017 (11)
Más de Fenalco Antioquia
Más de Fenalco Antioquia (20)
Último
Último (20)
Modelos vehículos más matriculados Colombia 2017
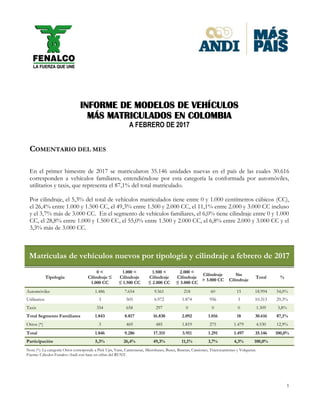
- 1. 1 INFORME DE MODELOS DE VEHÍCULOS MÁS MATRICULADOS EN COLOMBIA A FEBRERO DE 2017 COMENTARIO DEL MES En el primer bimestre de 2017 se matricularon 35.146 unidades nuevas en el país de las cuales 30.616 corresponden a vehículos familiares, entendiéndose por esta categoría la conformada por automóviles, utilitarios y taxis, que representa el 87,1% del total matriculado. Por cilindraje, el 5,3% del total de vehículos matriculados tiene entre 0 y 1.000 centímetros cúbicos (CC), el 26,4% entre 1.000 y 1.500 CC, el 49,3% entre 1.500 y 2.000 CC, el 11,1% entre 2.000 y 3.000 CC incluso y el 3,7% más de 3.000 CC. En el segmento de vehículos familiares, el 6,0% tiene cilindraje entre 0 y 1.000 CC, el 28,8% entre 1.000 y 1.500 CC, el 55,0% entre 1.500 y 2.000 CC, el 6,8% entre 2.000 y 3.000 CC y el 3,3% más de 3.000 CC. Matrículas de vehículos nuevos por tipología y cilindraje a febrero de 2017 Tipología 0 < Cilindraje ≤ 1.000 CC 1.000 < Cilindraje ≤ 1.500 CC 1.500 < Cilindraje ≤ 2.000 CC 2.000 < Cilindraje ≤ 3.000 CC Cilindraje > 3.000 CC Sin Cilindraje Total % Automóviles 1.486 7.654 9.561 218 60 15 18.994 54,0% Utilitarios 3 505 6.972 1.874 956 3 10.313 29,3% Taxis 354 658 297 0 0 0 1.309 3,8% Total Segmento Familiares 1.843 8.817 16.830 2.092 1.016 18 30.616 87,1% Otros (*) 3 469 485 1.819 275 1.479 4.530 12,9% Total 1.846 9.286 17.315 3.911 1.291 1.497 35.146 100,0% Participación 5,3% 26,4% 49,3% 11,1% 3,7% 4,3% 100,0% Nota (*): La categoría Otros corresponde a Pick Ups, Vans, Camionetas, Microbuses, Buses, Busetas, Camiones, Tractocamiones y Volquetas. Fuente: Cálculos Fenalco–Andi con base en cifras del RUNT.
- 2. 2 En este mismo período, las veinte líneas de vehículos más matriculadas en febrero suman 21.154 unidades, y de éstas, los vehículos familiares alcanzan las 20.188 unidades, es decir, el 95,4% de las veinte líneas de vehículos más matriculadas en el país corresponde a este segmento. □ Líneas de vehículos nuevos por cilindraje a febrero de 2017 Orden Línea 0 < Cilindraje ≤ 1.000 CC 1.000 < Cilindraje ≤ 1.500 CC 1.500 < Cilindraje ≤ 2.000 CC 2.000 < Cilindraje ≤ 3.000 CC Cilindraje > 3.000 CC Sin Cilindraje Total % 1 CHEVROLET SPARK 917 1.485 0 0 0 0 2.402 6,8% 2 CHEVROLET SAIL 0 2.030 0 0 0 0 2.030 5,8% 3 KIA PICANTO 546 1.014 0 0 0 0 1.560 4,4% 4 RENAULT LOGAN 0 0 1.495 0 0 0 1.495 4,3% 5 RENAULT DUSTER 0 0 1.475 0 0 0 1.475 4,2% 6 RENAULT SANDERO 0 0 1.444 0 0 0 1.444 4,1% 7 MAZDA 3 0 0 1.343 0 0 0 1.343 3,8% 8 RENAULT STEPWAY 0 0 1.121 0 0 0 1.121 3,2% 9 RENAULT CLIO 0 1.074 0 0 0 0 1.074 3,1% 10 CHEVROLET TRACKER 0 0 1.063 0 0 0 1.063 3,0% 11 FORD FIESTA 0 0 727 0 0 0 727 2,1% 12 NISSAN MARCH 0 0 722 0 0 0 722 2,1% 13 NISSAN FRONTIER 0 0 0 685 1 0 686 2,0% 14 MAZDA 2 0 668 0 0 0 0 668 1,9% 15 KIA RIO 0 620 1 0 0 0 621 1,8% 16 MAZDA CX-5 0 0 463 154 0 0 617 1,8% 17 CHEVROLET ONIX 0 563 0 0 0 0 563 1,6% 18 VOLKSWAGEN GOL 0 0 528 0 0 0 528 1,5% 19 RENAULT CAPTUR 0 0 524 0 0 0 524 1,5% 20 KIA NEW SPORTAGE 0 0 491 0 0 0 491 1,4% Total Veinte Líneas 1.463 7.454 11.397 839 1 0 21.154 60,2% OTRAS LÍNEAS 383 1.832 5.918 3.072 1.290 1.497 13.992 39,8% Total 1.846 9.286 17.315 3.911 1.291 1.497 35.146 100,0% Fuente: Cálculos Fenalco–Andi con base en cifras del RUNT.
- 3. 3 CONTENIDO Las siguientes tablas presentan un resumen de las diez líneas (modelos) más matriculadas por cada tipo de vehículo: Automóviles (además clasificados por área metropolitana), utilitarios, pick ups, vans, taxis, microbuses, busetas, buses, camionetas, vehículos de carga y volquetas, acumulado al mes de febrero y su comparativo respecto al año anterior. El término vehículos de carga se refiere a la categoría camiones comerciales de carga, tractocamiones y otros, que se clasifican según el Peso Bruto Vehicular (PBV) en tres categorías: De 0.0 a 10.5 toneladas incluso, de más de 10.5 a 28.0 toneladas incluso, Tractocamiones como categoría independiente, y Otros Camiones. Se emplea la sigla Tons.: Toneladas. □ Líneas más matriculadas a febrero de 2017 – Automóviles Orden Línea Acumulado febrero de 2016 Acumulado febrero de 2017 Distribución 2017 Variación 2017/2016 1 CHEVROLET SPARK 2.890 2.402 12,6% -16,9% 2 CHEVROLET SAIL 2.430 2.017 10,6% -17,0% 3 RENAULT LOGAN 1.773 1.450 7,6% -18,2% 4 RENAULT SANDERO 2.237 1.444 7,6% -35,4% 5 MAZDA 3 1.273 1.343 7,1% 5,5% 6 RENAULT STEPWAY 836 1.121 5,9% 34,1% 7 KIA PICANTO 1.185 1.070 5,6% -9,7% 8 RENAULT CLIO 477 1.069 5,6% 124,1% 9 FORD FIESTA 796 727 3,8% -8,7% 10 NISSAN MARCH 847 722 3,8% -14,8% OTRAS LÍNEAS 5.856 5.629 29,6% -3,9% Total 20.600 18.994 100,0% -7,8% Fuente: Cálculos Fenalco–Andi con base en cifras del RUNT. Líneas de Automóviles por área metropolitana a febrero de 2017 Orden Línea Bogotá,D.C. Medellín(Valle deAburrá) Cali Barranquilla Bucaramanga Centro Occidente Cartagenade Indias Ibagué Manizales Cúcuta Otras Total Distribución 1 CHEVROLET SPARK 652 340 367 95 92 78 50 71 32 83 542 2.402 12,6% 2 CHEVROLET SAIL 796 203 205 97 49 46 60 52 37 47 425 2.017 10,6%
- 4. 4 Líneas de Automóviles por área metropolitana a febrero de 2017 Orden Línea Bogotá,D.C. Medellín(Valle deAburrá) Cali Barranquilla Bucaramanga Centro Occidente Cartagenade Indias Ibagué Manizales Cúcuta Otras Total Distribución 3 RENAULT LOGAN 531 216 177 69 43 19 68 17 24 24 262 1.450 7,6% 4 RENAULT SANDERO 420 342 145 57 63 38 44 21 33 16 265 1.444 7,6% 5 MAZDA 3 524 270 161 87 34 21 25 23 21 29 148 1.343 7,1% 6 RENAULT STEPWAY 300 231 116 24 73 36 22 17 28 12 262 1.121 5,9% 7 KIA PICANTO 239 98 291 71 69 23 17 17 23 10 212 1.070 5,6% 8 RENAULT CLIO 412 149 134 38 46 21 23 14 19 17 196 1.069 5,6% 9 FORD FIESTA 350 97 77 23 37 19 15 18 12 13 66 727 3,8% 10 NISSAN MARCH 136 200 118 36 23 50 10 16 19 8 106 722 3,8% OTRAS LÍNEAS 2.318 808 706 214 220 125 79 119 125 93 822 5.629 29,6% Total 6.678 2.954 2.497 811 749 476 413 385 373 352 3.306 18.994 100,0% Fuente: Cálculos Fenalco–Andi con base en cifras del RUNT. Nota. Se utilizó la siguiente definición de área metropolitana, dada por agrupación de ciudades: Bogotá, D. C.: Comprende la ciudad de Bogotá, D. C. Cúcuta: Cúcuta, Villa del Rosario, Los Patios, El Zulia, San Cayetano y Puerto Santander. Barranquilla: Barranquilla, Puerto Colombia, Soledad, Malambo y Galapa. Ibagué: Ibagué, Cajamarca, Alvarado, Coello y Piedras. Bucaramanga: Bucaramanga, Floridablanca, Girón y Piedecuesta. Manizales: Manizales, Neira, Chinchiná, Villamaría y Palestina. Cali: Cali, Yumbo, Jamundí, Palmira y Candelaria. Neiva: Neiva, Rivera, Palermo, Tello, Campoalegre, Baraya, Aipe y Villavieja. Cartagena de Indias: Cartagena, Turbaco, Turbana, Clemencia, Santa Catalina, Santa Rosa y Villanueva. Centro Occidente: Pereira, Dosquebradas y La Virginia. Medellín (Valle de Aburrá): Medellín, Bello, Barbosa, Copacabana, La Estrella, Girardota, Itagüí, Envigado, Caldas y Sabaneta. Villavicencio: Villavicencio, Acacías, Guamal, Restrepo (Meta) y Cumaral. Líneas más matriculadas a febrero de 2017 – Utilitarios Orden Línea Acumulado febrero de 2016 Acumulado febrero de 2017 Distribución 2017 Variación 2017/2016 1 RENAULT DUSTER 1.839 1.192 11,6% -35,2% 2 CHEVROLET TRACKER 1.403 1.063 10,3% -24,2% 3 MAZDA CX-5 498 617 6,0% 23,9% 4 RENAULT CAPTUR 0 524 5,1% - 5 KIA NEW SPORTAGE 821 491 4,8% -40,2% 6 FORD ESCAPE 344 487 4,7% 41,6% 7 NISSAN KICKS 0 478 4,6% - 8 FORD ECOSPORT 469 354 3,4% -24,5% 9 TOYOTA PRADO 165 340 3,3% 106,1% 10 TOYOTA RAV4 74 313 3,0% 323,0% OTRAS LÍNEAS 4.393 4.454 43,2% 1,4% Total 10.006 10.313 100,0% 3,1% Fuente: Cálculos Fenalco–Andi con base en cifras del RUNT.
- 5. 5 Líneas más matriculadas a febrero de 2017 – Pick Ups Orden Línea Acumulado febrero de 2016 Acumulado febrero de 2017 Distribución 2017 Variación 2017/2016 1 NISSAN FRONTIER 452 575 33,6% 27,2% 2 RENAULT DUSTER 8 283 16,5% 3.437,5% 3 TOYOTA HILUX 267 177 10,4% -33,7% 4 RENAULT ALASKAN 0 124 7,3% - 5 CHEVROLET DMAX 156 107 6,3% -31,4% 6 VOLKSWAGEN AMAROK 135 101 5,9% -25,2% 7 FORD RANGER 60 100 5,8% 66,7% 8 MITSUBISHI L 200 6 34 2,0% 466,7% 9 MAZDA BT 50 98 31 1,8% -68,4% 10 FOTON BJ2037 52 26 1,5% -50,0% OTRAS LÍNEAS 291 152 8,9% -47,8% Total 1.525 1.710 100,0% 12,1% Fuente: Cálculos Fenalco–Andi con base en cifras del RUNT. Líneas más matriculadas a febrero de 2017 – Vans Orden Línea Acumulado febrero de 2016 Acumulado febrero de 2017 Distribución 2017 Variación 2017/2016 1 CHEVROLET N300 158 102 36,3% -35,4% 2 CHANGAN MINI 34 28 10,0% -17,6% 3 CHERY YOYA 44 28 10,0% -36,4% 4 RENAULT TRAFIC 0 24 8,5% - 5 DFSK EQ6450 27 22 7,8% -18,5% 6 BAIC MZ45 18 14 5,0% -22,2% 7 DFSK EQ6380 2 9 3,2% 350,0% 8 CHERY YOYO 18 8 2,8% -55,6% 9 CHANGHE FREEDOM 0 4 1,4% - 10 CITROËN BERLINGO 0 4 1,4% - OTRAS LÍNEAS 77 38 13,5% -50,6% Total 378 281 100,0% -25,7% Fuente: Cálculos Fenalco–Andi con base en cifras del RUNT.
- 6. 6 Líneas más matriculadas a febrero de 2017 – Taxis Orden Línea Acumulado febrero de 2016 Acumulado febrero de 2017 Distribución 2017 Variación 2017/2016 1 KIA PICANTO 322 490 37,4% 52,2% 2 CHEVROLET CHEVYTAXI 138 252 19,3% 82,6% 3 HYUNDAI GRAND 459 112 8,6% -75,6% 4 CHERY TIGGO 0 88 6,7% - 5 HYUNDAI I 10 0 78 6,0% - 6 KIA NEW SOUL 0 71 5,4% - 7 HYUNDAI ACCENT 71 68 5,2% -4,2% 8 RENAULT LOGAN 12 45 3,4% 275,0% 9 FAW CA7150 6 20 1,5% 233,3% 10 SUZUKI NEW ALTO K10 1 16 1,2% 1.500,0% OTRAS LÍNEAS 388 69 5,3% -82,2% Total 1.397 1.309 100,0% -6,3% Fuente: Cálculos Fenalco–Andi con base en cifras del RUNT. Líneas más matriculadas a febrero de 2017 – Microbuses – Capacidad de 10 a 19 pasajeros Orden Línea Acumulado febrero de 2016 Acumulado febrero de 2017 Distribución 2017 Variación 2017/2016 1 CHEVROLET NKR 40 51 23,8% 27,5% 2 MERCEDES-BENZ SPRINTER 33 46 21,5% 39,4% 3 RENAULT NUEVO MASTER MINIBUS 41 33 15,4% -19,5% 4 CHEVROLET NPR 19 27 12,6% 42,1% 5 VOLKSWAGEN CRAFTER 7 9 4,2% 28,6% 6 JOYLONG HKL6600C 3 8 3,7% 166,7% 7 JAC HFC 4 7 3,3% 75,0% 8 HYUNDAI H 1 5 6 2,8% 20,0% 9 MERCEDES-BENZ ATEGO 0 6 2,8% - 10 FOTON BJ6549 1 5 2,3% 400,0% OTRAS LÍNEAS 100 16 7,5% -84,0% Total 253 214 100,0% -15,4% Fuente: Cálculos Fenalco–Andi con base en cifras del RUNT. Líneas más matriculadas a febrero de 2017 – Busetas – Capacidad de 20 a 30 pasajeros Orden Línea Acumulado febrero de 2016 Acumulado febrero de 2017 Distribución 2017 Variación 2017/2016 1 CHEVROLET NPR 32 26 37,7% -18,8%
- 7. 7 Líneas más matriculadas a febrero de 2017 – Busetas – Capacidad de 20 a 30 pasajeros Orden Línea Acumulado febrero de 2016 Acumulado febrero de 2017 Distribución 2017 Variación 2017/2016 2 HINO XZU710L 10 18 26,1% 80,0% 3 CHEVROLET NKR 11 12 17,4% 9,1% 4 YUTONG ZK6729D 0 8 11,6% - 5 VOLKSWAGEN VW 0 2 2,9% - 6 HYUNDAI COUNTY 7 1 1,4% -85,7% 7 JAC HK 1 1 1,4% 0,0% 8 MITSUBISHI FUSO FE85DE6SLGP 0 1 1,4% - 9 NON PLUS ULTRA NPU 1 0 0,0% -100,0% 10 YUTONG ZK6720DF 1 0 0,0% -100,0% OTRAS LÍNEAS 0 0 0,0% - Total 63 69 100,0% 9,5% Fuente: Cálculos Fenalco–Andi con base en cifras del RUNT. Líneas más matriculadas a febrero de 2017 – Buses – Capacidad de más de 30 pasajeros Orden Línea Acumulado febrero de 2016 Acumulado febrero de 2017 Distribución 2017 Variación 2017/2016 1 HINO FC9JBUS 84 84 29,2% 0,0% 2 CHEVROLET NQR 90 53 18,4% -41,1% 3 CHEVROLET FRR 49 48 16,7% -2,0% 4 MERCEDES-BENZ ATEGO 0 20 6,9% - 5 AGRALE MA 0 17 5,9% - 6 JAC HK 0 14 4,9% - 7 AGRALE MA 17.0 EURO V 0 12 4,2% - 8 CHEVROLET LV452 3 11 3,8% 266,7% 9 YUTONG ZK6107HA 0 6 2,1% - 10 SCANIA K400 2 5 1,7% 150,0% OTRAS LÍNEAS 241 18 6,3% -92,5% Total 469 288 100,0% -38,6% Fuente: Cálculos Fenalco–Andi con base en cifras del RUNT. Líneas más matriculadas a febrero de 2017 – Camionetas Orden Línea Acumulado febrero de 2016 Acumulado febrero de 2017 Distribución 2017 Variación 2017/2016 1 CHEVROLET NHR 434 340 32,0% -21,7% 2 JAC HFC 92 123 11,6% 33,7%
- 8. 8 Líneas más matriculadas a febrero de 2017 – Camionetas Orden Línea Acumulado febrero de 2016 Acumulado febrero de 2017 Distribución 2017 Variación 2017/2016 3 NISSAN FRONTIER 104 108 10,2% 3,8% 4 HINO XZU640L 114 104 9,8% -8,8% 5 CHEVROLET N300 26 93 8,8% 257,7% 6 FOTON BJ1039 74 76 7,2% 2,7% 7 FOTON BJ1036 18 22 2,1% 22,2% 8 CHEVROLET DMAX 24 21 2,0% -12,5% 9 CHANGAN MINI TRUCK 4 19 1,8% 375,0% 10 DFSK EQ1020 12 18 1,7% 50,0% OTRAS LÍNEAS 107 137 12,9% 28,0% Total 1.009 1.061 100,0% 5,2% Fuente: Cálculos Fenalco–Andi con base en cifras del RUNT. Líneas más matriculadas a febrero de 2017 – Vehículos de Carga – 0.0 < PBV ≤ 10.5 Tons. Orden Línea Acumulado febrero de 2016 Acumulado febrero de 2017 Distribución 2017 Variación 2017/2016 1 CHEVROLET FRR 117 102 16,6% -12,8% 2 CHEVROLET NKR 95 78 12,7% -17,9% 3 JAC HFC 35 73 11,9% 108,6% 4 CHEVROLET NQR 102 48 7,8% -52,9% 5 CHEVROLET NPR 94 44 7,2% -53,2% 6 FOTON BJ1129 30 41 6,7% 36,7% 7 NISSAN CABSTAR 19 40 6,5% 110,5% 8 HINO FC9JJTA 34 26 4,2% -23,5% 9 FOTON BJ1061 23 24 3,9% 4,3% 10 HINO XZU720L 13 19 3,1% 46,2% OTRAS LÍNEAS 269 119 19,4% -55,8% Total 831 614 100,0% -26,1% Fuente: Cálculos Fenalco–Andi con base en cifras del RUNT. Líneas más matriculadas a febrero de 2017 – Vehículos de Carga – 10.5 < PBV ≤ 28.0 Tons. Orden Línea Acumulado febrero de 2016 Acumulado febrero de 2017 Distribución 2017 Variación 2017/2016 1 HINO GH8J 16 6 20,0% -62,5% 2 CHEVROLET FTR 8 5 16,7% -37,5% 3 CHEVROLET FVR 10 5 16,7% -50,0%
- 9. 9 Líneas más matriculadas a febrero de 2017 – Vehículos de Carga – 10.5 < PBV ≤ 28.0 Tons. Orden Línea Acumulado febrero de 2016 Acumulado febrero de 2017 Distribución 2017 Variación 2017/2016 4 IVECO TECTOR 0 3 10,0% - 5 VOLKSWAGEN VW 12 3 10,0% -75,0% 6 FREIGHTLINER M2 106 14 2 6,7% -85,7% 7 HINO FG8J CARGO 0 2 6,7% - 8 CHEVROLET FVZ 0 1 3,3% - 9 INTERNATIONAL 7600 SBA 6x4 0 1 3,3% - 10 INTERNATIONAL DURASTAR 4300 SBA 4x2 3 1 3,3% -66,7% OTRAS LÍNEAS 26 1 3,3% -96,2% Total 89 30 100,0% -66,3% Fuente: Cálculos Fenalco–Andi con base en cifras del RUNT. Líneas más matriculadas a febrero de 2017 – Otros Camiones Orden Línea Acumulado febrero de 2016 Acumulado febrero de 2017 Distribución 2017 Variación 2017/2016 1 CHEVROLET NQR 15 9 7,8% -40,0% 2 CHEVROLET FVR 6 8 6,9% 33,3% 3 KENWORTH T370 0 8 6,9% - 4 HINO FM8JLTD 12 7 6,0% -41,7% 5 KENWORTH T800 1 7 6,0% 600,0% 6 DAF FAT CF85 0 6 5,2% - 7 HINO FM8JRTA 0 6 5,2% - 8 CHEVROLET FTR 9 5 4,3% -44,4% 9 INTERNATIONAL WORKSTAR 7600 SBA 6X4 8 5 4,3% -37,5% 10 VOLKSWAGEN VW 11 5 4,3% -54,5% OTRAS LÍNEAS 131 50 43,1% -61,8% Total 193 116 100,0% -39,9% Fuente: Cálculos Fenalco–Andi con base en cifras del RUNT. Líneas más matriculadas a febrero de 2017 – Tractocamiones Orden Línea Acumulado febrero de 2016 Acumulado febrero de 2017 Distribución 2017 Variación 2017/2016 1 MACK CXU 613E 2 2 40,0% 0,0% 2 FREIGHTLINER CL 120 5 1 20,0% -80,0% 3 INTERNATIONAL 9400 ISBA 6x4 2 1 20,0% -50,0% 4 KENWORTH T460 0 1 20,0% -
- 10. 10 Líneas más matriculadas a febrero de 2017 – Tractocamiones Orden Línea Acumulado febrero de 2016 Acumulado febrero de 2017 Distribución 2017 Variación 2017/2016 5 FREIGHTLINER CASCADIA 1 0 0,0% -100,0% 6 FREIGHTLINER M2 106 1 0 0,0% -100,0% 7 HINO FG8JTC 1 0 0,0% -100,0% 8 HINO GH8J 1 0 0,0% -100,0% 9 HYUNDAI HD 1000 1 0 0,0% -100,0% 10 INTERNATIONAL PROSTAR 6x4 1 0 0,0% -100,0% OTRAS LÍNEAS 15 0 0,0% -100,0% Total 30 5 100,0% -83,3% Fuente: Cálculos Fenalco–Andi con base en cifras del RUNT. Líneas más matriculadas a febrero de 2017 – Volquetas Orden Línea Acumulado febrero de 2016 Acumulado febrero de 2017 Distribución 2017 Variación 2017/2016 1 INTERNATIONAL WORKSTAR 7600 SBA 6x4 82 55 38,7% -32,9% 2 DAF FAT CF85 0 32 22,5% - 3 HINO GH8J 6 14 9,9% 133,3% 4 FREIGHTLINER M2 33 12 8,5% -63,6% 5 TRI RING STQ3126L4Y43 0 5 3,5% - 6 FOTON BJ3122 0 3 2,1% - 7 INTERNATIONAL DURASTAR 4300 SBA 4x2 5 3 2,1% -40,0% 8 KENWORTH T800 7 3 2,1% -57,1% 9 CHEVROLET FVR 10 2 1,4% -80,0% 10 INTERNATIONAL 7600 3 2 1,4% -33,3% OTRAS LÍNEAS 29 11 7,7% -62,1% Total 175 142 100,0% -18,9% Fuente: Cálculos Fenalco–Andi con base en cifras del RUNT.