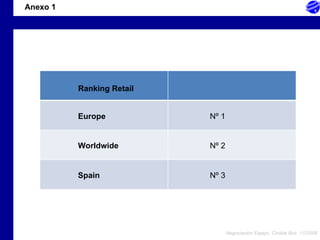
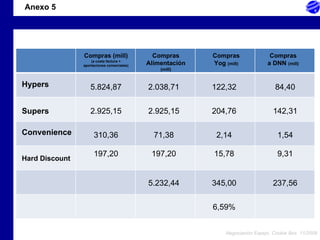
Ranking Retail Europe Worldwide Spain Nº 1 Nº 2 Nº 3 Anexo 1
Point of sales Hypers Supers Hard Discount Convenience Cash & carry Worldwide Spain 1.302 2.919 6.262 4.813 144 168 98 2.796 11 -- 15.440 3.073 12,9% 3,4% 44,7% 0,02% 0% Anexo 2
Sales (mill) Consolidated net sales (mill) ACDA (mill) Worldwide Europe (excl France) 108.629.000 86.967 5.100 3.300 40.192.730 1.155 14.067.456 404,25 Activity  Contribution  (mill) +6,4% +2,9% +0,3% Spain Anexo 3
Format Supers SPAIN Banner 4FOUR 4FOUR 4FOUR EXPRESS Convenience 57% 25% 3% % sobre total ventas del grupo en Esp. Ventas con IVA (millones de euros) Hypers Hard Discount DAY 15% 100% 8.018,19 3.516,75 422,01 2.110,05 14.067 Anexo 4
Supers 5.824,87 2.925,15 310,36 197,20 Convenience Compras (mill) (a coste factura + aportaciones comerciales) Hypers Hard Discount Compras Alimentación  (mill) 2.038,71 2.925,15 71,38 197,20 5.232,44 Compras Yog  (mill) 122,32 204,76 2,14 15,78 345,00 Compras a DNN  (mill) 84,40 142,31 1,54 9,31 237,56 6,59% Anexo 5
Detalle de recursos fuera de factura de DNN Hypers Supers Convenience 7.682.514,20 6.162.962,69 - 13.845.476,89 Hard Discount 1.161.036,07 28.851.989,85 Concepto Recursos Folletos Reponedores Promotores en PDV Cabeceras Promociones Refrigeradores 4.770.000 144.000 418.233,60 3.192.000 4.842.443,29 478.800 13.845.476,89 Anexo 6
OBJETIVOS E INCENTIVOS 2009 VENTAS DE LA CATEGORIA MASA DE  MARGEN OBTENIDA EN CAJA APORTACIONES FUERA DE FACTURA CUOTA  CATEGORÍA (GFK) BONOS RESULTADOS 4F ESPAÑA* OBJETIVO REAL COBERTURA BONUS (25.000 €) ALCANZANDO 100% COBERTURA X BONUS  100% 380.000.000 61.500.000 45.500.000 375.969.240 60.155.078,40 46.169.022,67 98,9% 97,8% 101,5% OBJETIVO REAL DIFERENCIA 17,80% 17,41% -0,39% 37% 35,20% -1,80% 5.000 5.000 5.000 5.000 5.000 TOTAL A  PERCIBIR 4.699,62 4.646,12 5.073,52 SOLO SI SE ALCANZA SOLO SI SE ALCANZA 14.419,26 PENALIZA 5% PENALIZA 5% * Equiparar peso de Activity Contribution a Net Sales Anexo 7
OBJETIVOS E INCENTIVOS 2010 - 2011 VENTAS DE LA CATEGORIA MASA DE  MARGEN OBTENIDA EN CAJA APORTACIONES FUERA DE FACTURA CUOTA  CATEGORÍA (GFK) BONOS RESULTADOS 4F ESPAÑA* OBJETIVO REAL COBERTURA BONUS (25.000 €) ALCANZANDO 100% COBERTURA X BONUS  100% 395.200.000 63.960.000 47.775.000 - - - 0% 0% 0% OBJETIVO REAL DIFERENCIA 18% 37% 5.000 5.000 5.000 2.000 3.000 TOTAL A  PERCIBIR - - - SOLO SI SE ALCANZA SOLO SI SE ALCANZA 14.419,26 * Equiparar peso de Activity Contribution a Net Sales CONSUMER DELIGHT INDEX Lograr 25% CS (sin que MS + CS baje del 80%) 5.000 DRIVER: "Posibilidad de escoger entre todas las opciones de precios, incluídas las más baratas del mercado (Amplitud + Precio)" VALORACION 2009: 68% SATISFECHOS y 12% COMPLETAMENTE SATISFECHOS+ Precio)" TOTAL BONUS 2010 25.000 Anexo 8
Concepto FUERA FACTURA Folletos Reponedores Promotores en PDV Cabeceras Promociones Refrigeradores 4.960.800 151.200 439.145,28 3.255.840 5.084.565,45 536.256 14.427.806,73 6,1% sobre compras Incremento 4,21 % Objetivos negociación con DNN para 2010 Cifra de compra 235.097.500 Incremento 3% - Argumentos - Mejora P Venta - Más recursos para problema  percepción de precios - Esfuerzo crisis - Gap con lo que aporta DNN en Francia Hay marcas que quieren entrar - Marca propia con fuerza – nuevo competidor real  Anexo 9
Objetivos negociación con DNN para 2010/2 30 SUPERS (30% SE CONVIERTEN EN DAY By Carrefour)  Tenemos que conseguir los mismos recursos En estos 30 supers la referenciación se reducirá un 35% Condiciones logísticas como en Supers, pero misma tarifa y mismas inversiones  Anexo 10

4f GráFicas

  • 1.
    Ranking Retail EuropeWorldwide Spain Nº 1 Nº 2 Nº 3 Anexo 1
  • 2.
    Point of salesHypers Supers Hard Discount Convenience Cash & carry Worldwide Spain 1.302 2.919 6.262 4.813 144 168 98 2.796 11 -- 15.440 3.073 12,9% 3,4% 44,7% 0,02% 0% Anexo 2
  • 3.
    Sales (mill) Consolidatednet sales (mill) ACDA (mill) Worldwide Europe (excl France) 108.629.000 86.967 5.100 3.300 40.192.730 1.155 14.067.456 404,25 Activity Contribution (mill) +6,4% +2,9% +0,3% Spain Anexo 3
  • 4.
    Format Supers SPAINBanner 4FOUR 4FOUR 4FOUR EXPRESS Convenience 57% 25% 3% % sobre total ventas del grupo en Esp. Ventas con IVA (millones de euros) Hypers Hard Discount DAY 15% 100% 8.018,19 3.516,75 422,01 2.110,05 14.067 Anexo 4
  • 5.
    Supers 5.824,87 2.925,15310,36 197,20 Convenience Compras (mill) (a coste factura + aportaciones comerciales) Hypers Hard Discount Compras Alimentación (mill) 2.038,71 2.925,15 71,38 197,20 5.232,44 Compras Yog (mill) 122,32 204,76 2,14 15,78 345,00 Compras a DNN (mill) 84,40 142,31 1,54 9,31 237,56 6,59% Anexo 5
  • 6.
    Detalle de recursosfuera de factura de DNN Hypers Supers Convenience 7.682.514,20 6.162.962,69 - 13.845.476,89 Hard Discount 1.161.036,07 28.851.989,85 Concepto Recursos Folletos Reponedores Promotores en PDV Cabeceras Promociones Refrigeradores 4.770.000 144.000 418.233,60 3.192.000 4.842.443,29 478.800 13.845.476,89 Anexo 6
  • 7.
    OBJETIVOS E INCENTIVOS2009 VENTAS DE LA CATEGORIA MASA DE MARGEN OBTENIDA EN CAJA APORTACIONES FUERA DE FACTURA CUOTA CATEGORÍA (GFK) BONOS RESULTADOS 4F ESPAÑA* OBJETIVO REAL COBERTURA BONUS (25.000 €) ALCANZANDO 100% COBERTURA X BONUS 100% 380.000.000 61.500.000 45.500.000 375.969.240 60.155.078,40 46.169.022,67 98,9% 97,8% 101,5% OBJETIVO REAL DIFERENCIA 17,80% 17,41% -0,39% 37% 35,20% -1,80% 5.000 5.000 5.000 5.000 5.000 TOTAL A PERCIBIR 4.699,62 4.646,12 5.073,52 SOLO SI SE ALCANZA SOLO SI SE ALCANZA 14.419,26 PENALIZA 5% PENALIZA 5% * Equiparar peso de Activity Contribution a Net Sales Anexo 7
  • 8.
    OBJETIVOS E INCENTIVOS2010 - 2011 VENTAS DE LA CATEGORIA MASA DE MARGEN OBTENIDA EN CAJA APORTACIONES FUERA DE FACTURA CUOTA CATEGORÍA (GFK) BONOS RESULTADOS 4F ESPAÑA* OBJETIVO REAL COBERTURA BONUS (25.000 €) ALCANZANDO 100% COBERTURA X BONUS 100% 395.200.000 63.960.000 47.775.000 - - - 0% 0% 0% OBJETIVO REAL DIFERENCIA 18% 37% 5.000 5.000 5.000 2.000 3.000 TOTAL A PERCIBIR - - - SOLO SI SE ALCANZA SOLO SI SE ALCANZA 14.419,26 * Equiparar peso de Activity Contribution a Net Sales CONSUMER DELIGHT INDEX Lograr 25% CS (sin que MS + CS baje del 80%) 5.000 DRIVER: "Posibilidad de escoger entre todas las opciones de precios, incluídas las más baratas del mercado (Amplitud + Precio)" VALORACION 2009: 68% SATISFECHOS y 12% COMPLETAMENTE SATISFECHOS+ Precio)" TOTAL BONUS 2010 25.000 Anexo 8
  • 9.
    Concepto FUERA FACTURAFolletos Reponedores Promotores en PDV Cabeceras Promociones Refrigeradores 4.960.800 151.200 439.145,28 3.255.840 5.084.565,45 536.256 14.427.806,73 6,1% sobre compras Incremento 4,21 % Objetivos negociación con DNN para 2010 Cifra de compra 235.097.500 Incremento 3% - Argumentos - Mejora P Venta - Más recursos para problema percepción de precios - Esfuerzo crisis - Gap con lo que aporta DNN en Francia Hay marcas que quieren entrar - Marca propia con fuerza – nuevo competidor real Anexo 9
  • 10.
    Objetivos negociación conDNN para 2010/2 30 SUPERS (30% SE CONVIERTEN EN DAY By Carrefour) Tenemos que conseguir los mismos recursos En estos 30 supers la referenciación se reducirá un 35% Condiciones logísticas como en Supers, pero misma tarifa y mismas inversiones Anexo 10