MINCETUR - Comercio bilateral Corea 2013
•
0 recomendaciones•242 vistas

Comercio bilateral con Corea del Sur 2013

Recomendados
Recomendados
Más contenido relacionado
La actualidad más candente
La actualidad más candente (17)
Similar a MINCETUR - Comercio bilateral Corea 2013
Similar a MINCETUR - Comercio bilateral Corea 2013 (20)
Más de Hernani Larrea
Más de Hernani Larrea (20)
Último
Último (20)
MINCETUR - Comercio bilateral Corea 2013
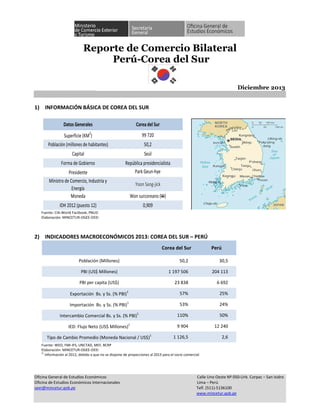
- 1. Reporte de Comercio Bilateral Perú-Corea del Sur Diciembre 2013 Oficina General de Estudios Económicos Calle Uno Oeste Nº 050-Urb. Corpac – San Isidro Oficina de Estudios Económicos Internacionales Lima – Perú oeei@mincetur.gob.pe Telf. (511)-5136100 www.mincetur.gob.pe 1) INFORMACIÓN BÁSICA DE COREA DEL SUR Datos Generales Corea del Sur Superficie (KM 2 ) 99 720 Población (millones de habitantes) 50,2 Capital Seúl Forma de Gobierno República presidencialista Presidente Park Geun-hye Ministro de Comercio, Industria y Energía Yoon Sang-jick Moneda Won surcoreano (W) IDH 2012 (puesto 12) 0,909 Fuente: CIA-World Factbook, PNUD Elaboración: MINCETUR-OGEE-OEEI 2) INDICADORES MACROECONÓMICOS 2013: COREA DEL SUR – PERÚ Corea del Sur Perú Población (Millones) 50,2 30,5 PBI (US$ Millones) 1 197 506 204 113 PBI per capita (US$) 23 838 6 692 Exportación Bs. y Ss. (% PBI) 1 57% 25% Importación Bs. y Ss. (% PBI) 1 53% 24% Intercambio Comercial Bs. y Ss. (% PBI) 1 110% 50% IED: Flujo Neto (US$ Millones) 1 9 904 12 240 Tipo de Cambio Promedio (Moneda Nacional / US$) 1 1 126,5 2,6 Fuente: WEO, FMI-IFS, UNCTAD, MEF, BCRP Elaboración: MINCETUR-OGEE-OEEI 1/ Información al 2012, debido a que no se dispone de proyecciones al 2013 para el socio comercial
- 2. Reporte de Comercio Bilateral Perú – Corea del Sur 2 3) INVERSIÓN EXTRANJERA DIRECTA (IED) DE COREA DEL SUR EN PERÚ − Corea del Sur es el país de origen de un 0,2% del stock de IED en Perú (al 31 de Diciembre de 2013). Estructura del stock de IED de Corea del Sur en Perú por sectores, 1980-2013 Sector US$ Millones Part.% Empresa receptora* Comercio 5,7 14,1 Finanzas 9,0 22,1 Industria 5,9 14,5 LG Electronics Perú S.A. Petróleo 0,1 0,2 Transporte 19,9 49,0 Transportadora de Gas del Perú S.A. Total 40,7 100,0 * Considera los principales inversionistas que han efectuado aportes de capital en el periodo 2001-2013, registrados en PROINVERSIÓN Fuente: PROINVERSIÓN Elaboración: MINCETUR-OGEE-OEEI Evolución del flujo de IED de Corea del Sur en Perú, 2003-2013 (US$ Millones) 11,1 5,5 -4,1 0,01 -6,0 -4,0 -2,0 0,0 2,0 4,0 6,0 8,0 10,0 12,0 2003 2004 2005 2006 2007 2008 2009 2010 2011 2012 2013 Fuente: PROINVERSIÓN Elaboración: MINCETUR-OGEE-OEEI
- 3. Reporte de Comercio Bilateral Perú – Corea del Sur 3 4) COMERCIO PERÚ-COREA DEL SUR Y CON EL MUNDO Las cifras de Exportaciones e Importaciones base SUNAT están actualizadas con fecha de cierre al 30/01/2014. Evolución del comercio Perú-Corea del Sur y con el Mundo, 2008-2013 (US$ Millones) 2008 2009 2010 2011 2012 2013* Comercio Corea del Sur - Mundo Exportaciones (FOB) 422 007 361 614 466 384 555 216 547 879 511 669 Importaciones (CIF) 435 275 322 843 425 212 524 418 519 569 471 152 Saldo Comercial (X-M) -13 267 38 771 41 172 30 798 28 310 40 517 Comercio Perú - Mundo (A) Exportaciones (FOB) 30 628 27 073 35 806 46 319 46 359 41 512 (B) Importaciones (CIF) 29 882 21 818 29 972 37 904 42 169 43 281 Saldo Comercial (X-M) 746 5 256 5 834 8 415 4 190 -1 769 Comercio Perú - Corea del Sur (C) Exportaciones (FOB) 543 750 896 1 696 1 546 1 536 (C)/(A) 1,8% 2,8% 2,5% 3,7% 3,3% 3,7% (D) Importaciones (CIF) 776 648 1 042 1 498 1 649 1 589 (D)/(B) 2,6% 3,0% 3,5% 4,0% 3,9% 3,7% Saldo Comercial (X-M) -233 102 -146 198 -103 -53 *Las últimas cifras disponibles de exportaciones e importaciones para Corea del Sur están actualizadas a Ene-Nov. 2013. Fuente: FMI-IFS (cifras de exportaciones e importaciones 2008-2013 para Corea del Sur) y SUNAT (cifras de exportaciones e importaciones 2008- 2013 para Perú) Elaboración: MINCETUR-OGEE-OEEI
- 4. Reporte de Comercio Bilateral Perú – Corea del Sur 4 5) EVOLUCIÓN DEL COMERCIO BILATERAL PERÚ – COREA DEL SUR Saldo Comercial Perú-Corea del Sur, 2008-2013 (US$ Millones) 543 750 896 1 696 1 546 1 536 776 648 1 042 1 498 1 649 1 589 -233 102 -146 198 -103 -53 -500 0 500 1 000 1 500 2 000 2008 2009 2010 2011 2012 2013 Exportaciones FOB Importaciones CIF SaldoComercial (X-M) Fuente: SUNAT Elaboración: MINCETUR-OGEE-OEEI
- 5. Reporte de Comercio Bilateral Perú – Corea del Sur 5 Exportaciones Perú-Corea del Sur, 2008-2013 (US$ Millones) 497 711 849 1 602 1 453 1 456 46 38 47 94 93 80 543 750 896 1 696 1 546 1 536 0 200 400 600 800 1 000 1 200 1 400 1 600 1 800 2008 2009 2010 2011 2012 2013 Tradicional NoTradicional Total Fuente: SUNAT Elaboración: MINCETUR-OGEE-OEEI Importaciones Perú-Corea del Sur, 2008-2013 (US$ Millones) 287 252 390 407 416 448 311 206 343 579 505 466179 191 310 512 727 674 776 648 1 042 1 498 1 649 1 589 0 200 400 600 800 1 000 1 200 1 400 1 600 1 800 2008 2009 2010 2011 2012 2013 Materias Primas Bienes de Capital Bienes de Consumo Total Fuente: SUNAT Elaboración: MINCETUR-OGEE-OEEI
- 6. Reporte de Comercio Bilateral Perú – Corea del Sur 6 Comercio Perú-Corea del Sur, 2011-2013 (US$ Millones / Variaciones %) 2011 2012 Var. 2012/2011 2012 2013 Var. 2013/2012 Exportaciones (FOB) 1 696,1 1 546,0 -8,8% 1 546,0 1 536,4 -0,6%- - . Tradicional 1 602,4 1 453,1 -9,3% 1 453,1 1 456,4 0,2% - Agrícolas 50,8 30,9 -39,2% 30,9 30,9 0,3% Café 50,8 30,9 -39,2% 30,9 30,9 0,3% - Minero 1 322,3 1 415,2 7,0% 1 415,2 1 123,4 -20,6% Cobre 567,1 558,0 -1,6% 558,0 464,1 -16,8% Hierro - 0,0 - Metales Menores 0,4 0,2 -44,2% 0,2 2,0 725,0% Oro - 0,01 - Plomo 557,4 641,9 15,2% 641,9 436,7 -32,0% Zinc 197,4 215,0 8,9% 215,0 220,6 2,6% - Pesquero 5,4 7,1 30,6% 7,1 6,1 -13,3% Aceite de Pescado 1,7 1,7 -3,2% 1,7 3,7 123,6% Harina de Pescado 3,7 5,4 46,1% 5,4 2,4 -55,0% - Petróleo y Gas Natural 223,9 - 296,0 - Derivados de petróleo 0,04 - 20,5 - Gas Natural 223,9 - 275,5 - . No Tradicional 93,7 92,9 -0,8% 92,9 80,0 -13,9% - Agropecuario 4,6 12,8 175,2% 12,8 16,2 26,3% - Artesanías - 0,0 - - Maderas y Papeles 0,5 1,1 121,3% 1,1 0,7 -34,7% - Metal-Mecánico 0,2 0,5 231,9% 0,5 0,6 7,4% - Minería No Metálica 3,3 0,0 -99,1% 0,0 0,1 172,4% - Pesquero 67,8 64,9 -4,3% 64,9 52,2 -19,6% - Pieles y Cueros 0,0 0,0 -15,8% 0,0 0,5 3 138% - Químico 4,5 2,5 -44,1% 2,5 1,8 -28,2% - Sidero Metalúrgico 4,1 4,2 2,8% 4,2 1,4 -66,4% - Textil 8,6 6,7 -22,2% 6,7 6,5 -2,9% - Varios (inc. joyería) 0,1 0,1 123,9% 0,1 0,1 -29,2% Importaciones (CIF) 1 498,0 1 648,5 10,1% 1 648,5 1 589,0 -3,6% . Bienes de Consumo 512,1 727,2 42,0% 727,2 673,5 -7,4% . 406,6 416,2 2,4% 416,2 447,7 7,6% . 579,3 505,1 -12,8% 505,1 465,7 -7,8% . Diversos 0,0003 - 0,0003 2,1 752 722%- -- - Saldo Comercial (X-M) 198,1 -102,5 -151,8% -102,5 -52,6 -48,7% Intercambio Comercial (X+M) 3 194,0 3 194,5 0,02% 3 194,5 3 125,4 -2,2% Materias Primas y Productos Intermedios Bienes de Capital y Materiales de Construcción Fuente: SUNAT Elaboración: MINCETUR-OGEE-OEEI
- 7. Reporte de Comercio Bilateral Perú – Corea del Sur 7 Principales Empresas Exportadoras e Importadoras Principales Empresas Exportadoras a Corea del Sur, 2011-2013 (Miles de US$ FOB / Participaciones % / Variaciones %) 2011 2012 2013* Miles (US$) Part. % Miles (US$) Part. % Miles (US$) Part. % 1 PERU LNG S.R.L. 223 892 13,2% 275 477 17,9% 2 COMPANIA MINERA ANTAMINA S.A 229 777 13,5% 221 234 14,3% 213 121 13,9% -3,7 3 GLENCORE PERU S.A.C. 217 187 12,8% 234 191 15,1% 182 303 11,9% -22,2 4 VOLCAN COMPANIA MINERA S.A.A. 90 121 5,3% 149 279 9,7% 166 248 10,8% 11,4 5 XSTRATA TINTAYA S.A. 95 605 5,6% 18 228 1,2% 103 216 6,7% 466,3 6 GOLD FIELDS LA CIMA S.A.A. 130 176 7,7% 92 731 6,0% 93 485 6,1% 0,8 7 MINERA SUYAMARCA SOCIEDAD ANONIMA CERRAD 81 069 4,8% 100 679 6,5% 85 466 5,6% -15,1 8 CONSORCIO MINERO S A CORMIN 281 354 16,6% 317 707 20,6% 79 594 5,2% -74,9 9 SOUTHERN PERU COPPER CORPORATION SUCURSA L DEL PERU 5 853 0,3% 83 099 5,4% 41 484 2,7% -50,1 10 EMPRESA ADMINISTRADORA CHUNGAR S.A.C. 5 330 0,3% 11 957 0,8% 37 054 2,4% 209,9 11 EMPRESA ADMINISTRADORA CERRO S.A.C 14 714 0,9% 19 939 1,3% 35 461 2,3% 77,8 12 VOTORANTIM METAIS - CAJAMARQUILLA S.A. 3 647 0,2% 23 849 1,6% 553,9 13 PLUSPETROL PERU CORPORATION S.A. 20 505 1,3% 14 PERALES HUANCARUNA S.A.C. 5 148 0,3% 7 911 0,5% 16 347 1,1% 106,6 15 SOCIEDAD MINERA CERRO VERDE S.A.A. 68 574 4,0% 63 302 4,1% 13 003 0,8% -79,5 16 ICM PACHAPAQUI S.A.C. 2 345 0,1% 11 445 0,7% 12 083 0,8% 5,6 17 C N C, S.A.C. 15 801 0,9% 20 953 1,4% 10 666 0,7% -49,1 18 M.I.K. - CARPE SOCIEDAD ANONIMA CERRADA 11 247 0,7% 12 486 0,8% 9 058 0,6% -27,5 19 DOE RUN PERU S.R.L. 7 852 0,5% 20 CIA.INTERNACIONAL DEL CAFE S.A.C. 6 622 0,4% 2 406 0,2% 6 956 0,5% 189,1 SUBTOTAL 1 484 815 87,5% 1 371 193 88,7% 1 433 228 93,3% 4,5 RESTO 211 276 12,5% 174 804 11,3% 103 158 6,7% -41,0 TOTAL 1 696 091 100,0% 1 545 997 100,0% 1 536 386 100,0% -0,6 N° Razón Social % Variac. Periodo 2013/2012 *El ranking de las empresas exportadoras está en función a los valores registrados en el 2013 Fuente: SUNAT Elaboración: MINCETUR-OGEE-OEEI
- 8. Reporte de Comercio Bilateral Perú – Corea del Sur 8 Principales Empresas Importadoras desde Corea del Sur, 2011-2013 (Miles de US$ CIF / Participaciones % / Variaciones %) 2011 2012 2013* Miles (US$) Part. % Miles (US$) Part. % Miles (US$) Part. % 1 AUTOMOTORES GILDEMEISTER-PERU S.A. 280 658 18,7% 363 308 22,0% 255 186 16,1% -29,8 2 KIA IMPORT PERU S.A.C. 157 639 10,5% 207 787 12,6% 254 828 16,0% 22,6 3 LG ELECTRONICS PERU S.A. 120 161 8,0% 163 612 9,9% 118 484 7,5% -27,6 4 GENERAL MOTORS PERU S A 71 617 4,8% 105 068 6,4% 98 645 6,2% -6,1 5 CEMENTOS LIMA S.A.A. 0,1 0,0% 16 134 1,0% 53 469 3,4% 231,4 6 MINISTERIO DEL INTERIOR 28 572 1,8% 7 CEMENTOS PACASMAYO S.A.A. 13 617 0,8% 20 925 1,3% 53,7 8 AMCOR RIGID PLASTICS DEL PERU S.A. 657 0,0% 12 372 0,8% 19 223 1,2% 55,4 9 DAEWOO ELECTRONICS CORPORATION S.A.C. 10 024 0,7% 14 160 0,9% 17 869 1,1% 26,2 10 COMREIVIC S.A.C. 5 305 0,4% 14 096 0,9% 15 628 1,0% 10,9 11 ALTOS ANDES S.A.C 10 647 0,7% 15 673 1,0% 14 049 0,9% -10,4 12 TELEFONICA MOVILES S.A 12 538 0,8% 2 393 0,1% 13 367 0,8% 458,6 13 INTRADEVCO INDUSTRIAL S.A. 8 755 0,6% 9 095 0,6% 13 261 0,8% 45,8 14 COMPANIA WITHMORY S.R.LTDA. 12 117 0,8% 16 160 1,0% 12 796 0,8% -20,8 15 ANDINA PLAST S R L 9 867 0,7% 11 115 0,7% 11 898 0,7% 7,0 16 OPP FILM S.A. 457 0,0% 1 410 0,1% 10 998 0,7% 679,7 17 XIMESA S.A.C. 13 309 0,9% 5 183 0,3% 10 657 0,7% 105,6 18 MINISTERIO DE SALUD 3 852 0,3% 5 656 0,3% 10 477 0,7% 85,2 19 POLINPLAST S.A.C. 4 633 0,3% 5 542 0,3% 9 557 0,6% 72,4 20 COMERCIAL DEL ACERO S A 6 030 0,4% 27 536 1,7% 9 345 0,6% -66,1 SUBTOTAL 728 266 48,6% 1 009 916 61,3% 999 233 62,9% -1,1 RESTO 769 691 51,4% 638 623 38,7% 589 799 37,1% -7,6 TOTAL 1 497 958 100,0% 1 648 539 100,0% 1 589 032 100,0% -3,6 N° Razón Social % Variac. Periodo 2013/2012 *El ranking de las empresas importadoras está en función a los valores registrados en el 2013 Fuente: SUNAT Elaboración: MINCETUR-OGEE-OEEI
- 9. Reporte de Comercio Bilateral Perú – Corea del Sur 9 Principales Productos de Exportación e Importación Principales Subpartidas Tradicionales Exportadas a Corea del Sur y al Mundo, 2011-2013 (US$ Miles FOB / Participaciones % / Variaciones %) Var.% X Perú-Corea del Sur (A) X Perú- Mundo (B) Indicador (A) / (B) X Perú-Corea del Sur (A) X Perú- Mundo (B) Indicador (A) / (B) X Perú-Corea del Sur (A) Part. % X Perú- Mundo (B) Indicador (A) / (B) X Perú- Corea del Sur 13/12 1 2603000000 MINERALES DE COBRE Y SUS CONCENTRADOS 551 601 7 797 056 7,1% 469 615 8 418 758 5,6% 406 960 27,9% 7 602 491 5,4% -13,3 2 2607000000 MINERALES DE PLOMO Y SUS CONCENTRADOS 413 282 1 783 057 23,2% 485 584 1 996 479 24,3% 299 200 20,5% 1 144 003 26,2% -38,4 3 2711110000 GAS NATURAL, LICUADO 223 892 1 283 510 17,4% 0 1 330 561 0,0% 275 477 18,9% 1 371 836 20,1% 4 2608000000 MINERALES DE CINC Y SUS CONCENTRADOS 197 372 1 183 173 16,7% 215 018 1 042 794 20,6% 200 853 13,8% 1 038 307 19,3% -6,6 5 2616100000 MINERALES DE PLATA Y SUS CONCENTRADOS 144 116 631 535 22,8% 156 318 574 479 27,2% 129 852 8,9% 455 825 28,5% -16,9 6 7403110000 CÁTODOS Y SECCIONES DE CÁTODOS, DE COBRE REFINADO 5 853 2 716 729 0,2% 42 645 1 967 714 2,2% 41 484 2,8% 2 102 676 2,0% -2,7 7 0901119000 CAFÉ SIN TOSTAR, SIN DESCAFEINAR, EXCEPTO PARA SIEMBRA 50 784 1 592 711 3,2% 30 865 1 021 989 3,0% 30 942 2,1% 691 342 4,5% 0,3 8 7901110000 ZINC EN BRUTO, SIN ALEAR, CON UN CONTENIDO DE ZINC SUPERIOR O IGUAL AL 99,99% EN PESO 19 781 1,4% 373 753 5,3% 9 2711120000 PROPANO, LICUADO 14 239 1,0% 137 286 10,4% 10 7401001000 MATAS DE COBRE 7 658 0,5% 18 788 40,8% 11 7801100000 PLOMO REFINADO, EN BRUTO 7 639 0,5% 149 303 5,1% 12 2711130000 BUTANOS, LICUADOS 6 266 0,4% 62 760 10,0% 13 7404000000 DESPERDICIOS Y DESECHOS, DE COBRE 7 199 45 838 15,7% 4 632 43 575 10,6% 6 151 0,4% 32 029 19,2% 32,8 14 1504201000 GRASAS Y ACEITES DE PESCADO Y SUS FRACCIONES, EXCEPTO LOS ACEITES DE HÍGADO, EN BRUTO 1 233 234 907 0,5% 1 107 433 325 0,3% 3 218 0,2% 229 109 1,4% 190,7 15 2301201100 HARINA, POLVO Y «PELLETS», DE PESCADO, CON UN CONTENIDO DE GRASA SUPERIOR A 2% EN PESO, IMPROPIOS PARA LA ALIMENTACIÓN HUMANA 3 715 1 774 633 0,2% 5 428 1 770 048 0,3% 2 442 0,2% 1 358 502 0,2% -55,0 16 7401002000 COBRE DE CEMENTACIÓN (COBRE PRECIPITADO) 2 434 3 665 66,4% 655 4 056 16,1% 1 828 0,1% 3 148 58,1% 179,2 17 8112921090 DEMÁS EN BRUTO; POLVO 1 418 0,1% 6 909 20,5% 18 2613900000 DEMÁS MINERALES DE MOLIBDENO Y SUS CONCENTRADOS 425 563 600 0,1% 237 429 133 0,1% 540 0,0% 358 156 0,2% 127,6 19 1504209000 DEMÁS GRASAS Y ACEITES DE PESCADO Y SUS FRACCIONES, EXCEPTO LOS ACEITES DE HÍGADO 473 97 780 0,5% 544 108 339,9 0,5% 474 0,0% 112 736 0,4% -12,8 20 7108120000 ORO EN DEMÁS FORMAS, EN BRUTO, INCLUIDO EL ORO PLATINADO, EXCEPTO PARA USO MONETARIO 12 0,0% 7 813 152 0,0% SUBTOTAL 1 602 380 19 708 193 8,1% 1 412 648 19 141 251 7,4% 1 456 436 100,0% 25 062 112 5,8% 3,1 RESTO 44 16 421 274 40 455 16 011 354 0,2 0,0% 5 512 497 -100,0 TOTAL EXPORTACIONES TRADICIONALES 1 602 424 36 129 467 4,4% 1 453 103 35 152 604 4,1% 1 456 436 100,0% 30 574 609 4,8% 0,2 2011 2012 2013 2 N° Subpartida 1 DESCRIPCIÓN Fuente: SUNAT Elaboración: MINCETUR-OGEE-OEEI 1: Subpartidas del Sistema Armonizado 2007 y 2012. Debido a que se ha producido aperturas y cierres de subpartidas, no necesariamente las cifras para una misma subpartida son comparables antes y después del 2012. 2: El ranking de los productos tradicionales exportados a Corea del Sur está en función a los valores registrados en el 2013
- 10. Reporte de Comercio Bilateral Perú – Corea del Sur 10 Principales Subpartidas No Tradicionales Exportadas a Corea del Sur y al Mundo, 2011-2013 (US$ Miles FOB / Participaciones % / Variaciones %) Var.% X Perú-Corea del Sur (A) X Perú- Mundo (B) Indicador (A) / (B) X Perú-Corea del Sur (A) X Perú- Mundo (B) Indicador (A) / (B) X Perú-Corea del Sur (A) Part. % X Perú- Mundo (B) Indicador (A) / (B) X Perú- Corea del Sur 13/12 1 1605540000 JIBIAS (SEPIAS) Y CALAMARES 28 058 159 121 17,6% 21 585 27,0% 132 413 16,3% -23,1 2 0307490000 LOS DEMAS JIBIAS (SEPIA OFFICINALIS, ROSSIA MACROSOMA) Y GLOBITOS (SEPIOLA SPP.); CALAMARES Y POTAS (OMMASTREPHES SPP., LOLIGO SPP., 18 645 230 751 8,1% 27 244 238 071 11,4% 19 210 24,0% 260 926 7,4% -29,5 3 0806100000 UVAS FRESCAS 1 541 287 186 0,5% 9 071 366 414 2,5% 12 141 15,2% 441 096 2,8% 33,8 4 0304690000 LOS DEMÁS, DENTRO DE FILETES CONGELADOS DE TILAPIAS, BAGRES O PEZ GATO, CARPAS, ANGUILAS Y DE PECES CABEZA DE SERPIENTE - EXCEPTO 3 080 6 093 50,5% 4 684 5,9% 6 035 77,6% 52,1 5 0304890000 LOS DEMÁS, DENTRO DE FILETES CONGELADSO DE LOS DEMAS PESCADOS, EXCEPTO SALMONES DEL PACIFICO, SALMONES DEL ATLANTICO Y 1 965 42 809 4,6% 2 589 3,2% 32 761 7,9% 31,8 6 5108200000 HILADOS DE PELO FINO PEINADO, SIN ACONDICIONAR PARA LA VENTA AL POR MENOR. 2 479 18 915 13,1% 1 630 21 708 7,5% 2 343 2,9% 21 072 11,1% 43,8 7 0306171100 LANGOSTINOS (GENEROS DE LAS FAMILA PENAEIDAE) ENTEROS; DENTRO DE LOS DEMAS CAMARONES, LANGOSTINOS Y DEMAS DECÁPODOS NATANTIA, 2 151 2,7% 26 208 8,2% 8 0803901100 BANANAS TIPO «CAVENDISH VALERY», FRESCOS 1 541 80 366 1,9% 1 523 1,9% 88 136 1,7% -1,1 9 2301209000 HARINA, POLVO Y «PELLETS» DE CRUSTÁCEOS, MOLUSCOS O DEMÁS INVERTEBRADOS ACUÁTICOS, IMPROPIOS PARA LA ALIMENTACIÓN 49 15 103 0,3% 115 21 387 0,5% 937 1,2% 18 388 5,1% 711,7 10 0709200000 ESPÁRRAGOS, FRESCOS O REFRIGERADOS 199 293 678 0,1% 481 343 091 0,1% 636 0,8% 409 200 0,2% 32,2 11 0303900000 HÍGADOS, HUEVAS Y LECHAS; DENTRO DE PESCADOS CONGELADO, EXCEPTO LOS FILETES Y DEMAS CARNE DE PESCADO DE LA PARTIDA 0304 1 989 18 091 11,0% 623 0,8% 7 005 8,9% -68,7 12 3203002100 CARMÍN DE COCHINILLA 2 758 81 647 3,4% 958 34 943 2,7% 614 0,8% 21 625 2,8% -35,9 13 7602000000 DESPERDICIOS Y DESECHOS, DE ALUMINIO 2 124 11 636 18,3% 1 726 10 423 16,6% 525 0,7% 7 961 6,6% -69,6 14 5112901000 DEMÁS TEJIDOS DE LANA PEINADA, EXCEPTO CON UN CONTENIDO DE LANA SUPERIOR O IGUAL AL 85% EN PESO, MEZCLADOS EXCLUSIVA O 1 472 1 831 80,4% 1 529 2 174 70,3% 517 0,6% 1 469 35,2% -66,2 15 7604291000 DEMÁS BARRAS DE ALEACIONES DE ALUMINIO 104 1 830 5,7% 807 2 767 29,2% 515 0,6% 903 57,0% -36,2 16 0811909100 MANGO (MANGIFERA INDICA L.), SIN COCER O COCIDOS EN AGUA O VAPOR, CONGELADOS 218 24 896 0,9% 226 29 955 0,8% 458 0,6% 40 088 1,1% 103,0 17 6310900000 DEMÁS TRAPOS, CORDELES, CUERDAS Y CORDAJES DE MATERIAS TEXTILES, EN DESPERDICIOS O ARTÍCULOS DESECHOS, NO CLASIFICADOS 327 546 59,9% 229 637 36,0% 418 0,5% 421 99,5% 82,4 18 2308009000 DEMÁS MATERIAS VEGETALES Y DESPERDICIOS VEGETALES, RESIDUOS Y SUBPRODUCTOS VEGETALES, INCLUSO EN «PELLETS», DE LOS TIPOS 397 0,5% 416 95,4% 19 9619001000 PAÑALES PARA BEBÉS 414 39 099 1,1% 396 0,5% 48 580 0,8% -4,4 20 5105391000 PELO FINO CARDADO O PEINADO, DE ALPACA O DE LLAMA 1 651 43 962 3,8% 919 30 548 3,0% 377 0,5% 39 418 1,0% -59,0 SUBTOTAL 31 566 1 011 980 3,1% 81 983 1 447 695 5,7% 72 642 90,9% 1 604 119 4,5% -11,4 RESTO 62 101 9 177 889 10 911 9 758 583 7 308 9,1% 9 333 078 -33,0 TOTAL EXPORTACIONES NO TRADICIONALES 93 667 10 189 869 0,9% 92 894 11 206 279 0,8% 79 950 100,0% 10 937 198 0,7% -13,9 2013 2 N° Subpartida 1 DESCRIPCIÓN 2011 2012 Fuente: SUNAT Elaboración: MINCETUR-OGEE-OEEI 1: Subpartidas del Sistema Armonizado 2007 y 2012. Debido a que se ha producido aperturas y cierres de subpartidas, no necesariamente las cifras para una misma subpartida son comparables antes y después del 2012. 2: El ranking de los productos no tradicionales exportados a Corea del Sur está en función a los valores registrados en el 2013
- 11. Reporte de Comercio Bilateral Perú – Corea del Sur 11 Principales Subpartidas Importadas desde Corea del Sur y del Mundo, 2011-2013 (US$ Miles CIF / Participaciones % / Variaciones %) Var.% M Perú-Corea del Sur (A) M Perú- Mundo (B) Indicador (A) / (B) M Perú-Corea del Sur (A) M Perú- Mundo (B) Indicador (A) / (B) M Perú-Corea del Sur (A) Part. % M Perú- Mundo (B) Indicador (A) / (B) M Perú- Corea del Sur 13/12 1 8703239020 DEMÁS VEHICULOS ENSAMBLADOS CON MOTOR DE ÉMBOLO O PISTÓN ALTERNATIVO, DE ENCENDIDO POR CHISPA, PARA EL TRANSPORTE DE PERSONAS, DE CILINDRADA SUPERIOR A 1.500 CM3 PERO INFERIOR O IGUAL 241 074 619 358 38,9% 363 257 870 489 41,7% 327 728 20,6% 891 189 36,8% -9,8 2 8703229020 DEMÁS VEHICULOS ENSAMBLADOS CON MOTOR DE ÉMBOLO O PISTÓN ALTERNATIVO, DE ENCENDIDO POR CHISPA, PARA EL TRANSPORTE DE PERSONAS, DE CILINDRADA SUPERIOR A 1.000 CM3 PERO INFERIOR O IGUAL 77 767 317 025 24,5% 116 127 480 218 24,2% 125 785 7,9% 473 604 26,6% 8,3 3 8528720000 DEMÁS APARATOS RECEPTORES DE TELEVISIÓN, INCLUSO CON APARATO RECEPTOR DE RADIODIFUSIÓN O GRABACIÓN O REPRODUCCIÓN DE SONIDO 107 990 384 038 28,1% 140 466 431 988 32,5% 96 547 6,1% 453 594 21,3% -31,3 4 2523100000 CEMENTOS SIN PULVERIZAR («CLINKER») 12 720 29 872 42,6% 31 742 50 924 62,3% 81 297 5,1% 97 790 83,1% 156,1 5 8703210010 DEMÁS VEHÍCULOS CON MOTOR DE ÉMBOLO O PISTÓN ALTERNATIVO, DE ENCENDIDO POR CHISPA, PARA EL TRANSPORTE DE PERSONAS, DE 19 697 48 795 40,4% 39 384 83 430 47,2% 47 954 3,0% 125 777 38,1% 21,8 6 3902100000 POLIPROPILENO 29 867 272 322 11,0% 27 386 265 020 10,3% 44 450 2,8% 289 913 15,3% 62,3 7 3901200000 POLIETILENO DE DENSIDAD SUPERIOR O IGUAL A 0,94 28 564 184 721 15,5% 22 834 185 332 12,3% 41 159 2,6% 195 171 21,1% 80,3 8 3902300000 COPOLÍMEROS DE PROPILENO 26 415 82 523 32,0% 22 770 77 997 29,2% 36 192 2,3% 93 370 38,8% 58,9 9 8704211090 DEMÁS VEHÍCULOS PARA EL TRANSPORTE DE MERCANCÍAS, CON MOTOR DE ÉMBOLO O PISTÓN, DE ENCENDIDO POR COMPRESIÓN (DIESEL O 26 037 52 395 49,7% 33 301 58 628 56,8% 35 072 2,2% 68 608 51,1% 5,3 10 3907609000 DEMÁS POLI(TEREFTALATO DE ETILENO) 13 537 193 208 7,0% 22 376 179 573 12,5% 34 693 2,2% 175 883 19,7% 55,0 11 7216330000 PERFILES DE HIERRO O DE ACERO SIN ALEAR, EN "H" SIMPLEMENTE LAMINADOS O EXTRUIDOS EN CALIENTE, DE ALTURA SUPERIOR O IGUAL A 9 554 29 790 32,1% 36 584 55 509 65,9% 25 975 1,6% 45 725 56,8% -29,0 12 8702101000 VEHÍCULOS AUTOMÓVILES PARA EL TRANSPORTE DE UN MÁXIMO DE 16 PERSONAS, INCLUIDO EL CONDUCTOR, CON MOTOR DE ÉMBOLO O PISTÓN, 64 259 181 530 35,4% 41 081 167 570 24,5% 24 529 1,5% 154 186 15,9% -40,3 13 8704222000 DEMÁS VEHÍCULOS PARA EL TRANSPORTE DE MERCANCÍAS, CON MOTOR DE ÉMBOLO O PISTÓN, DE ENCENDIDO POR COMPRESIÓN (DIESEL O 25 916 95 981 27,0% 30 632 104 125 29,4% 24 490 1,5% 97 115 25,2% -20,1 14 8450200000 MÁQUINA PARA LAVAR ROPA DE CAPACIDAD UNITARIA, EXPRESADA EN PESO DE ROPA SECA, SUPERIOR A 10 KG 12 968 59 998 21,6% 25 151 76 152 33,0% 23 670 1,5% 85 447 27,7% -5,9 15 2917320000 ORTOFTALATOS DE DIOCTILO 23 025 24 227 95,0% 21 485 22 140 97,0% 22 780 1,4% 22 938 99,3% 6,0 16 2837111000 CIANURO DE SODIO 18 435 72 994 25,3% 23 578 106 706 22,1% 22 063 1,4% 117 021 18,9% -6,4 17 8703231000 CAMPEROS (4 X 4), CON MOTOR DE ÉMBOLO O PISTÓN ALTERNATIVO, DE ENCENDIDO POR CHISPA, PARA EL TRANSPORTE DE PERSONAS, DE 22 073 121 100 18,2% 22 124 161 908 13,7% 21 183 1,3% 112 721 18,8% -4,3 18 8429520000 PALAS MECÁNICAS, EXCAVADORAS, CARGADORAS Y PALAS CARGADORAS, CUYA SUPERESTRUCTURA PUEDA GIRAR 360O 22 873 223 380 10,2% 36 000 231 103 15,6% 18 589 1,2% 288 077 6,5% -48,4 19 4011201000 RADIALES DE LOS TIPOS UTILIZADOS EN AUTOBUSES Y CAMIONES 13 890 119 620 11,6% 17 739 153 219 11,6% 18 288 1,2% 159 078 11,5% 3,1 20 8517120000 TELÉFONOS MÓVILES (CELULARES) Y LOS DE OTRAS REDES INALÁMBRICAS 24 067 550 592 4,4% 9 135 659 849 1,4% 18 031 1,1% 861 806 2,1% 97,4 SUBTOTAL 820 726 3 663 468 22,4% 1 083 152 4 421 878 24,5% 1 090 475 68,6% 4 809 011 22,7% 0,7 RESTO 677 232 34 240 555 565 387 37 746 759 498 557 31,4% 38 471 676 -11,8 TOTAL IMPORTACIONES 1 497 958 37 904 023 4,0% 1 648 539 42 168 636 3,9% 1 589 032 100,0% 43 280 687 3,7% -3,6 2011 2012 N° Subpartida1 DESCRIPCIÓN 20132 Fuente: SUNAT Elaboración: MINCETUR-OGEE-OEEI 1: Subpartidas del Sistema Armonizado 2007 y 2012. Debido a que se ha producido aperturas y cierres de subpartidas, no necesariamente las cifras para una misma subpartida son comparables antes y después del 2012 2: El ranking de los productos importados desde Corea del Sur está en función a los valores registrados en el 2013
- 12. Reporte de Comercio Bilateral Perú – Corea del Sur 12 Número de Productos Exportados/Importados y Número de Empresas por Rango de Ventas/Compras 2003 2004 2005 2006 2007 2008 2009 2010 2011 2012 2013 Sub Partidas exportadas 198 189 199 161 210 209 216 238 254 275 272 Total empresas 143 158 179 203 213 205 200 217 252 272 277 Con exportaciones menores a US$ 100 mil 83 81 98 111 127 119 125 130 147 146 156 Con exportaciones entre US$ 100 mil y 1 millón 42 55 56 58 47 48 45 48 58 80 72 Con exportaciones superiores a US$ 1 millón 18 22 25 34 39 38 30 39 47 46 49 Distribución del valor exportado según rango de ventas 176 360 202 960 227 430 548 397 887 905 542 898 749 594 895 993 1 696 091 1 545 997 1 536 386 Con exportaciones menores a US$ 100 mil 2 171 2 365 1 969 2 612 2 703 2 421 2 419 2 983 3 813 3 796 3 702 Con exportaciones entre US$ 100 mil y 1 millón 16 141 19 240 22 889 22 657 16 398 17 184 15 846 17 286 18 684 27 632 24 630 Con exportaciones superiores a US$ 1 millón 158 048 181 355 202 572 523 128 868 804 523 293 731 328 875 724 1 673 595 1 514 570 1 508 055 Fuente: SUNAT Elaboración: MINCETUR-OGEE-OEEI 2003 2004 2005 2006 2007 2008 2009 2010 2011 2012 2013 Sub Partidas importadas 1 568 1 576 1 677 1 681 1 961 1 853 1 879 2 067 2 075 2 045 2 025 Total empresas 4 170 1 623 1 904 2 072 2 174 2 523 2 565 2 630 2 593 2 645 2 622 Con importaciones menores a US$ 100 mil 3 883 1 330 1 588 1 709 1 783 2 080 2 135 2 113 2 034 2 034 2 008 Con importaciones entre US$ 100 mil y 1 millón 247 249 262 295 317 328 351 409 418 463 462 Con importaciones superiores a US$ 1 millón 40 44 54 68 74 115 79 108 141 148 152 Distribución del valor exportado según rango de compras 278 328 296 310 349 029 391 895 521 808 776 046 648 081 1 042 415 1 497 958 1 648 539 1 589 032 Con importaciones menores a US$ 100 mil 30 240 24 094 26 047 28 304 28 228 36 837 36 290 37 244 34 674 35 784 33 708 Con importaciones entre US$ 100 mil y 1 millón 83 247 81 438 92 185 95 053 108 513 113 683 113 967 136 941 129 955 152 732 153 476 Con importaciones superiores a US$ 1 millón 164 841 190 779 230 796 268 537 385 066 625 526 497 824 868 231 1 333 329 1 460 023 1 401 848 Fuente: SUNAT Elaboración: MINCETUR-OGEE-OEEI Evolución del número de subpartidas exportadas y de exportadores-según rango de sus ventas anuales hacia Corea del Sur (Sub Partidas y Empresas en Unidades; Valor exportado en Miles de US$ FOB) Evolución del número de subpartidas importadas y de importadores-según rango de sus compras anuales desde Corea del Sur (Sub Partidas y Empresas en Unidades; Valor importado en Miles de US$ CIF)