Descargar para leer sin conexión


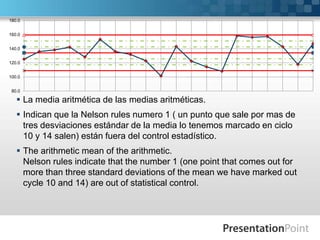


Este documento presenta un gráfico de control estadístico y analiza los datos utilizando las reglas de Nelson y Western Electric. El resumen encuentra que dos puntos están fuera del límite de tres desviaciones estándar y hay una tendencia de puntos a estar ligeramente fuera de control, indicando que el proceso no está completamente bajo control estadístico. También encuentra que los puntos se alternan en dirección, aumentando y disminuyendo, según la regla 4 de Nelson. El gráfico de control ayuda a evaluar la calidad del proceso median


