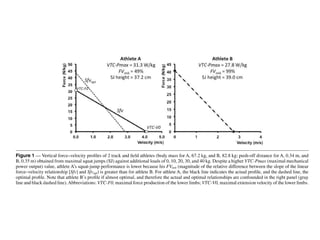
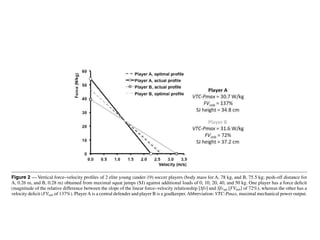
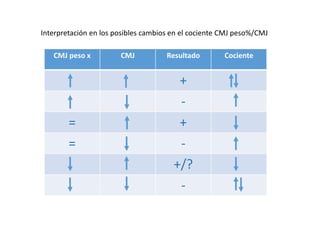
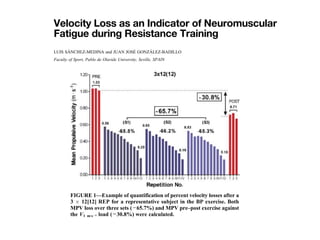
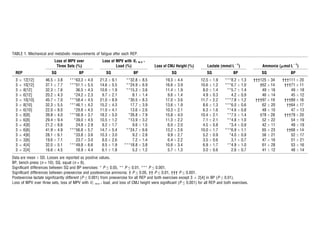
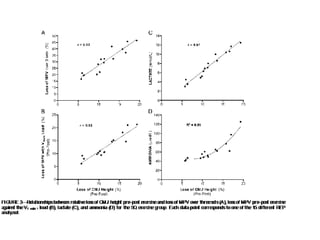
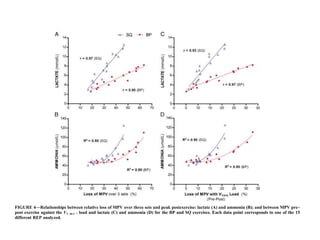
¿por qué valorar el salto vertical?
¿de que depende el rendimiento en el salto vertical?
¿qué cualidad mecánica del sistema neuromuscular me interesa mejorar más?
Cross et al Optimal loading in sled2
of resisted sprinting protocols in the literature (e.g.
sleds10
), no attempt has been made to profile optima
conditions for maximising power production. Ther
aims of this study were to: (1) assess whether a mul
method, using resisted sprint sleds to supply resistan
be used to accurately and reliably profile FvP rela
during over-ground sprinting; (2) quantify and presen
loading conditions for maximising power and; (3)
mechanical characteristics between highly trained
and recreational cohorts.
Methods
Participants
12 recreational level mixed-sport athletes and 1
trained sprinters gave their written informed conse
part in this study, after being made aware of the pr
and risks and benefits of study participation. The tw
were selected to provide a proof-of-concept for the a
ity of the profiling method to athletes both highly fam
resisted sprinting, and athletes with mixed familiari
Sprinters were required to have attained a performan
ard of at least 750 IAAF points19
in an event ≤400
the previous season. The mean current (within seaso
PERFIL DEL
DEPORTISTA
PERFILFUERZA-VELOCIDAD Y POTENIA-VELOCIDAD PARA DOS
SALTO VERTICAL CON CONTRAMOVIMIENTO (CMJ)
 Diferentes pesos para el cácululo de la curva fuerza (peso) velocidad (altura)
 Valida para analizar las carácterísticas de velocidad en el salto del sujeto
 Valorar la progresión en el transcurso del entrenamiento
 Tambíen se puede conseguir la curva de potencia aplicando la siguiente
formula: P=(Pc + Pb) * 9,81* 2 ∙ 9,8 ∙ ℎ
COEFICIENTE FUERZA VELOCIDAD= CMJP/CMJ
 Según el valor de esta relación se determinan las características del
sujeto en relación con las variables fuerza-velocidad y el efecto
producido sobre ellas por el entrenamiento; si el cociente es muy alto o
crece con el entrenamiento es que le estamos dando un énfasis al
trabajo de fuerza máxima, por el contrario si baja estaremos primando
el trabajo de velocidad con cargas ligeras
 Este cociente podría ser utilizado con todos los pesos utilizados en el
test
 El peso utilizado no tiene que ser necesariamente igual al peso corporal
(solo sería aconsejable en sujetos con gran fuerza y potencia)
 El peso máximo que se debería utilizar no debería ser superior a aquel
con el que la altura del salto no fuese inferior a 13-14 cm.
CMJ peso x CMJ Resultado Cociente
+
-
= +
= -
+/?
-
Interpretación en los posibles cambios en el cociente CMJ peso%/CMJ
ARRANCA
DA
Velocidad media
acelerativa (m/s) % de 1 RM
Velocidad media
acelerativa con 1
Rm
1,15 (±0,12) 91 (±5,6) 1,04 (±0,09)
Velocidad media
acelerativa (m/s) % de 1 RM
Velocidad media
acelerativa con 1
Rm
1,15 (±0,12) 91 (±5,6) 1,04 (±0,09)
1,09 (±0,1) 87 (±6,7) 0,9 (± 0,08)Velocidad media
acelerativa (m/s) % de 1 RM
Velocidad media
acelerativa con 1
Rm
1,09 (±0,1) 87 (±6,7) 0,9 (± 0,08)
CARGADA
Velocidad media
acelerativa (m/s) % de 1 RM
Velocidad media
acelerativa con 1
Rm
0,76 (±0,09) 65 (±7,6) 0,31 (±0,07)
SENTADIL
LA
Velocidad media
acelerativa (m/s) % de 1 RM
Velocidad media
acelerativa con 1
Rm
1,15 (±0,1) 40 (±5,5) 0,2 (±0,05)
PRESS
BANCA
SQUAT
JUMP
“the load that maximizes power output
was 0%1-RM “JIMENEZ REYES, P. ET
AL (2015)
CONTRAMOVEMENT JUMP
“jump height close to 20 cm”
Loturco, I. et al (2015)
Jimenez Reyes, P. Et al (2016)
CARRERA
LASTRADA
"69-96% of body-mass,
dependent on friction conditions”
(Matt R. Cross et al 2016)
N=51 hombres atletas (sprinter y lanzadores)
Objetivo: Examinar la relación entre la carga relativa en las sentadillas
completas y la altura alcanzada en los ejercicios de salto-sentadilla (JS) y
determinar la carga que maximiza la potencia de salida de los atletas de alto
nivel.
Métodos: Se midieron la repetición máxima en full squat (1-RM) y la
altura de JS (JH) con cargas de 17 a 97 kg en 2 sesiones separadas por 48 h
Resultados: Los análisis de regresión lineal mostraron que JH (R2 = 0,992
± 0,005) y la disminución de salto (JD) que cada carga producida con
respecto al salto de contramovimiento sin peso (CMJ) (R2 = 0,992 ± 0,007)
están altamente correlacionadas con el % de squat en 1-RM, lo que
significa que las intensidades de entrenamiento pueden prescribirse usando
los valores JH y JD
between mean test velocity from T1 to T2, a negative and sig-
nificant correlation could be identified (r =− 0.42, P<0.01). A
positive, but non-significant, correlation (r =0.23, P=0.091) was
found when comparing changes in V1RM from T1 to T2 and differ-
ences in mean test velocity.
−− Fig. 3 provides examples of the load-velocity relationships for
three representative subjects. −− Fig. 3a corresponds to one
subject who improved his 1RM value by 11.8 %(from 85–95 kg).
V1RM in T1 (0.16 m ·s− 1
) was almost identical to that of T2
(0.14 m ·s− 1
), while MPV with each %1RM and mean test velocity
remained stable. −− Fig. 3b shows an extreme case, the subject
who showed the greatest change in the load-velocity curve from
T1 to T2. He improved his 1RM (14.8 %, from 115–132 kg), but
V1RM in T2 (0.06 m ·s− 1
) and mean test velocity (0.69m ·s− 1
) were
both considerably lower to those of T1 (0.17 m ·s− 1
and
0.75 m ·s− 1
, respectively). MPV attained with each relative load
were lower in T2 than in T1. Finally, the subject whose curves
are shown in −− Fig. 3c did not improve his maximal strength
(1RM value slightly decreased by 2.2 %, from 112.5–110kg). For
this subject, V1RM in T1 (0.10m ·s− 1
) and T2 (0.12 m ·s− 1
) were
very similar, and mean test velocity was the same on both occa-
sions (0.73 m ·s− 1
). MPV attained with each percentage of 1RM
in T1 and T2 were almost identical.
Stability in the load-velocity relationship regardlessof
individual relative strength
In order to study whether the velocity attained with each %1RM
was dependent upon individual strength levels, subjects were
ranked according to relative strength ratio (RSR) and the total
sample of 176 tests was further divided into four subgroups:
group 1 (G1), n =45, RSR − 0.97; group 2 (G2), n =44, 0.97 <
RSR − 1.09; group 3 (G3), n =44, 1.09 < RSR − 1.22; and group 4
(G4), n =43, RSR >1.22. Mean test velocity for G4 was signifi-
cantly lower (P<0.05) than for all other groups. No significant
differences in V1RM were found between groups, although cer-
tain tendency towards slightly lower values was detected for the
strongest group (G4) (−− Table 2).
Predicting load ( %1RM) from velocity data
0.0
20 40 60
Load (%1RM)
80 100
Fig. 1 Relationship between relative load (%1RM) and MPV directly
obtained from 1596 raw data derived from the 176 incremental tests
performed in the BPexercise. Solid line showsthe fitted curve to the data,
and the dotted linesindicate limitswithin which 95%of predictions will
fall.
Table 1 Changesin mean propulsive velocity (m ·s− 1
) attained with each
relative load, from initial test (T1) to retest (T2), after 6-wk of training, in the
bench press exercise.
Load ( %1RM) T1 T2 Difference
(T1–T2)
30% 1.33±0.08 1.33±0.08 0.00
35% 1.24±0.07 1.23±0.07 0.01
40% 1.15±0.06 1.14±0.06 0.01
45% 1.06±0.05 1.05±0.05 0.01
50% 0.97±0.05 0.96±0.05 0.01
55% 0.89±0.05 0.87±0.05 0.01*
60% 0.80±0.05 0.79±0.05 0.01
65% 0.72±0.05 0.71±0.05 0.01
70% 0.64±0.05 0.63±0.05 0.01
75% 0.56±0.04 0.55±0.04 0.01
80% 0.48±0.04 0.47±0.04 0.01
85% 0.41±0.04 0.40±0.04 0.01
90% 0.33±0.04 0.32±0.04 0.01
95% 0.26±0.03 0.25±0.03 0.01
100% 0.19±0.04 0.18±0.04 0.00*
* Does not exactly coincide with T1-T2 due to the shown valuesbeing the result of
rounding to two decimal places. Values are mean±SD (N=56).
0.95
0.85
0.75
Velocity(ms-1
)
Downloadedby:UNIVERSIDADPABLOOLAVIDE.Copyrightedmaterial.
VELOCIDAD DE EJECUCIÓN COMO MEDIDA DE LA I
Este carácter de esfuerzo define larelación entre lo
realizado y lo realizable.
Un mismo estímulo externo (x) podrá representar
un carácter de esfuerzo diferente en distintos
momentos o situaciones.
Debemos conocer el nivel de exigencia que ha
supuesto dicho estímulo para cada sujeto en cada
momento.
“Carácter de esfuerzo”
González-Badillo (1995)
RM en cada serie mientras que el grupo NRF realizó
s (es decir, la mitad de volumen). Después de las 8
entrenamiento, se observó que el grupo NRF mejoró
que utilizar repeticiones al fallo (cuando no más),
probablemente debido, entre otros factores, al m
fatiga que produce en el organismo. Sin embargo
A partir de la mitad de las repeticiones, la pérdida de velocidad es notable. Nótese que en la última repetición posible la
velocidad es muy próxima a la asociada a la RM (ver Capítulo 2).
Figura 5.2 Pérdida de velocidad dentro de una serie de sentadilla
0,400
0,525
0,650
0,775
0,900
1 2 3 4 5 6 7 8 9 10 11 12 13 14 15 16 17 18 19 20 21 22 23 24 25 26
Velocidadmediapropulsiva(m/s)
Nº repetición
Effects of velocity loss during resistance training on athletic
performance, strength gains and muscle adaptations
F. Pareja-Blanco1
, D. Rodrıguez-Rosell1
, L. Sanchez-Medina2
, J. Sanchis-Moysi3,4
, C. Dorado3,4
, R. Mora-Custodio1
,
J. M. Ya~nez-Garcıa1
, D. Morales-Alamo3,4
, I. Perez-Suarez3,4
, J. A. L. Calbet3,4
, J. J. Gonzalez-Badillo1
1
Physical Performance & Sports Research Center, Pablo de Olavide University, Seville, Spain, 2
Studies, Research & Sports
M edicine Center, Government of Navarre, Pamplona, Spain, 3
Department of Physical Education, Las Palmas de Gran Canaria
University, Las Palmas de Gran Canaria, Spain, 4
Research Institute of Biomedical and Health Sciences ( IUIBS) , Las Palmas de
Gran Canaria University, Las Palmas de Gran Canaria, Spain
Corresponding author: Fernando Pareja-Blanco, Centro de Investigacion en Rendimiento Fısico y Deportivo, Universidad Pablo de
Olavide, Ctra. de Utrera km 1, 41013 Seville, Spain. Tel.: + 34 653121522; Fax: + 34 954 348 659; E-mail: fparbla@gmail.com
Accepted for publication 23 February 2016
We compared the effects of two resistance training (RT)
programs only differing in the repetition velocity loss
allowed in each set: 20% (VL20) vs 40% (VL40) on
muscle structural and functional adaptations. Twenty-two
young males were randomly assigned to a VL20 (n = 12)
or VL40 (n = 10) group. Subjects followed an 8-week
velocity-based RT program using the squat exercise while
monitoring repetition velocity. Pre- and post-training
assessments included: magnetic resonance imaging, vastus
lateralis biopsies for muscle cross-sectional area (CSA)
and fiber type analyses, one-repetition maximum strength
and full load-velocity squat profile, countermovement jump
(CMJ), and 20-m sprint running. VL20 resulted in similar
squat strength gains than VL40 and greater improvements
in CMJ (9.5% vs 3.5%, P < 0.05), despite VL20
performing 40% fewer repetitions. Although both groups
increased mean fiber CSA and whole quadriceps muscle
volume, VL40 training elicited a greater hypertrophy of
vastus lateralis and intermedius than VL20. Training
resulted in a reduction of myosin heavy chain IIX
percentage in VL40, whereas it was preserved in VL20. In
conclusion, the progressive accumulation of muscle fatigue
as indicated by a more pronounced repetition velocity loss
appears as an important variable in the configuration of
the resistance exercise stimulus as it influences functional
and structural neuromuscular adaptations.
Objetivo: Comparamos los efectos de dos programas de entrenamiento de fuerza(RT) que sólo difieren en la pérdida de
velocidad : 20% (VL20) vs. 40% (VL40) en las adaptacionesestructurales y funcionales del músculo.
Métodos: Veintidós varones jóvenes fueron asignados aleatoriamente a un grupo VL20 (n = 12) o VL40 (n = 10). Los
sujetos siguieron un programa de RT basado en velocidad de 8 semanas usando el ejercicio de sentadillas mientras se
monitorizaba la velocidad de repetición. Las evaluaciones previas y posteriores a la capacitación incluyeron: resonancia
magnética, biopsias del vasto lateral para análisis del tipo de fibra, análisis de tipo de fibra, fuerza máxima de una repetición
y perfil de sentadillade carga máxima, salto de contramovimiento (CMJ) y Carrera de 20 metros en sprint.
Resultados:VL20 tuvo similares ganancias de fuerza en squat que VL40 y mayores mejoras en CMJ (9.5% vs 3.5%, P
<0.05), a pesar de VL20 realizando un 40% menos repeticiones. Aunque ambos grupos tuvieron un aumento de la sección
trasversal y del volumen total del músculo cuádriceps, el entrenamiento con VL40 provocó una mayor hipertrofia de vasto
lateral e interno que VL20.
3 Entrenamiento potencia

3 Entrenamiento potencia

  • 1.
    ¿por qué valorarel salto vertical? ¿de que depende el rendimiento en el salto vertical? ¿qué cualidad mecánica del sistema neuromuscular me interesa mejorar más?
  • 2.
    Cross et alOptimal loading in sled2 of resisted sprinting protocols in the literature (e.g. sleds10 ), no attempt has been made to profile optima conditions for maximising power production. Ther aims of this study were to: (1) assess whether a mul method, using resisted sprint sleds to supply resistan be used to accurately and reliably profile FvP rela during over-ground sprinting; (2) quantify and presen loading conditions for maximising power and; (3) mechanical characteristics between highly trained and recreational cohorts. Methods Participants 12 recreational level mixed-sport athletes and 1 trained sprinters gave their written informed conse part in this study, after being made aware of the pr and risks and benefits of study participation. The tw were selected to provide a proof-of-concept for the a ity of the profiling method to athletes both highly fam resisted sprinting, and athletes with mixed familiari Sprinters were required to have attained a performan ard of at least 750 IAAF points19 in an event ≤400 the previous season. The mean current (within seaso PERFIL DEL DEPORTISTA
  • 3.
  • 7.
    SALTO VERTICAL CONCONTRAMOVIMIENTO (CMJ)  Diferentes pesos para el cácululo de la curva fuerza (peso) velocidad (altura)  Valida para analizar las carácterísticas de velocidad en el salto del sujeto  Valorar la progresión en el transcurso del entrenamiento  Tambíen se puede conseguir la curva de potencia aplicando la siguiente formula: P=(Pc + Pb) * 9,81* 2 ∙ 9,8 ∙ ℎ
  • 8.
    COEFICIENTE FUERZA VELOCIDAD=CMJP/CMJ  Según el valor de esta relación se determinan las características del sujeto en relación con las variables fuerza-velocidad y el efecto producido sobre ellas por el entrenamiento; si el cociente es muy alto o crece con el entrenamiento es que le estamos dando un énfasis al trabajo de fuerza máxima, por el contrario si baja estaremos primando el trabajo de velocidad con cargas ligeras  Este cociente podría ser utilizado con todos los pesos utilizados en el test  El peso utilizado no tiene que ser necesariamente igual al peso corporal (solo sería aconsejable en sujetos con gran fuerza y potencia)  El peso máximo que se debería utilizar no debería ser superior a aquel con el que la altura del salto no fuese inferior a 13-14 cm.
  • 9.
    CMJ peso xCMJ Resultado Cociente + - = + = - +/? - Interpretación en los posibles cambios en el cociente CMJ peso%/CMJ
  • 11.
    ARRANCA DA Velocidad media acelerativa (m/s)% de 1 RM Velocidad media acelerativa con 1 Rm 1,15 (±0,12) 91 (±5,6) 1,04 (±0,09)
  • 12.
    Velocidad media acelerativa (m/s)% de 1 RM Velocidad media acelerativa con 1 Rm 1,15 (±0,12) 91 (±5,6) 1,04 (±0,09) 1,09 (±0,1) 87 (±6,7) 0,9 (± 0,08)Velocidad media acelerativa (m/s) % de 1 RM Velocidad media acelerativa con 1 Rm 1,09 (±0,1) 87 (±6,7) 0,9 (± 0,08) CARGADA
  • 13.
    Velocidad media acelerativa (m/s)% de 1 RM Velocidad media acelerativa con 1 Rm 0,76 (±0,09) 65 (±7,6) 0,31 (±0,07) SENTADIL LA
  • 14.
    Velocidad media acelerativa (m/s)% de 1 RM Velocidad media acelerativa con 1 Rm 1,15 (±0,1) 40 (±5,5) 0,2 (±0,05) PRESS BANCA
  • 15.
    SQUAT JUMP “the load thatmaximizes power output was 0%1-RM “JIMENEZ REYES, P. ET AL (2015)
  • 16.
    CONTRAMOVEMENT JUMP “jump heightclose to 20 cm” Loturco, I. et al (2015) Jimenez Reyes, P. Et al (2016)
  • 17.
    CARRERA LASTRADA "69-96% of body-mass, dependenton friction conditions” (Matt R. Cross et al 2016)
  • 18.
    N=51 hombres atletas(sprinter y lanzadores) Objetivo: Examinar la relación entre la carga relativa en las sentadillas completas y la altura alcanzada en los ejercicios de salto-sentadilla (JS) y determinar la carga que maximiza la potencia de salida de los atletas de alto nivel. Métodos: Se midieron la repetición máxima en full squat (1-RM) y la altura de JS (JH) con cargas de 17 a 97 kg en 2 sesiones separadas por 48 h Resultados: Los análisis de regresión lineal mostraron que JH (R2 = 0,992 ± 0,005) y la disminución de salto (JD) que cada carga producida con respecto al salto de contramovimiento sin peso (CMJ) (R2 = 0,992 ± 0,007) están altamente correlacionadas con el % de squat en 1-RM, lo que significa que las intensidades de entrenamiento pueden prescribirse usando los valores JH y JD
  • 19.
    between mean testvelocity from T1 to T2, a negative and sig- nificant correlation could be identified (r =− 0.42, P<0.01). A positive, but non-significant, correlation (r =0.23, P=0.091) was found when comparing changes in V1RM from T1 to T2 and differ- ences in mean test velocity. −− Fig. 3 provides examples of the load-velocity relationships for three representative subjects. −− Fig. 3a corresponds to one subject who improved his 1RM value by 11.8 %(from 85–95 kg). V1RM in T1 (0.16 m ·s− 1 ) was almost identical to that of T2 (0.14 m ·s− 1 ), while MPV with each %1RM and mean test velocity remained stable. −− Fig. 3b shows an extreme case, the subject who showed the greatest change in the load-velocity curve from T1 to T2. He improved his 1RM (14.8 %, from 115–132 kg), but V1RM in T2 (0.06 m ·s− 1 ) and mean test velocity (0.69m ·s− 1 ) were both considerably lower to those of T1 (0.17 m ·s− 1 and 0.75 m ·s− 1 , respectively). MPV attained with each relative load were lower in T2 than in T1. Finally, the subject whose curves are shown in −− Fig. 3c did not improve his maximal strength (1RM value slightly decreased by 2.2 %, from 112.5–110kg). For this subject, V1RM in T1 (0.10m ·s− 1 ) and T2 (0.12 m ·s− 1 ) were very similar, and mean test velocity was the same on both occa- sions (0.73 m ·s− 1 ). MPV attained with each percentage of 1RM in T1 and T2 were almost identical. Stability in the load-velocity relationship regardlessof individual relative strength In order to study whether the velocity attained with each %1RM was dependent upon individual strength levels, subjects were ranked according to relative strength ratio (RSR) and the total sample of 176 tests was further divided into four subgroups: group 1 (G1), n =45, RSR − 0.97; group 2 (G2), n =44, 0.97 < RSR − 1.09; group 3 (G3), n =44, 1.09 < RSR − 1.22; and group 4 (G4), n =43, RSR >1.22. Mean test velocity for G4 was signifi- cantly lower (P<0.05) than for all other groups. No significant differences in V1RM were found between groups, although cer- tain tendency towards slightly lower values was detected for the strongest group (G4) (−− Table 2). Predicting load ( %1RM) from velocity data 0.0 20 40 60 Load (%1RM) 80 100 Fig. 1 Relationship between relative load (%1RM) and MPV directly obtained from 1596 raw data derived from the 176 incremental tests performed in the BPexercise. Solid line showsthe fitted curve to the data, and the dotted linesindicate limitswithin which 95%of predictions will fall. Table 1 Changesin mean propulsive velocity (m ·s− 1 ) attained with each relative load, from initial test (T1) to retest (T2), after 6-wk of training, in the bench press exercise. Load ( %1RM) T1 T2 Difference (T1–T2) 30% 1.33±0.08 1.33±0.08 0.00 35% 1.24±0.07 1.23±0.07 0.01 40% 1.15±0.06 1.14±0.06 0.01 45% 1.06±0.05 1.05±0.05 0.01 50% 0.97±0.05 0.96±0.05 0.01 55% 0.89±0.05 0.87±0.05 0.01* 60% 0.80±0.05 0.79±0.05 0.01 65% 0.72±0.05 0.71±0.05 0.01 70% 0.64±0.05 0.63±0.05 0.01 75% 0.56±0.04 0.55±0.04 0.01 80% 0.48±0.04 0.47±0.04 0.01 85% 0.41±0.04 0.40±0.04 0.01 90% 0.33±0.04 0.32±0.04 0.01 95% 0.26±0.03 0.25±0.03 0.01 100% 0.19±0.04 0.18±0.04 0.00* * Does not exactly coincide with T1-T2 due to the shown valuesbeing the result of rounding to two decimal places. Values are mean±SD (N=56). 0.95 0.85 0.75 Velocity(ms-1 ) Downloadedby:UNIVERSIDADPABLOOLAVIDE.Copyrightedmaterial. VELOCIDAD DE EJECUCIÓN COMO MEDIDA DE LA I
  • 20.
    Este carácter deesfuerzo define larelación entre lo realizado y lo realizable. Un mismo estímulo externo (x) podrá representar un carácter de esfuerzo diferente en distintos momentos o situaciones. Debemos conocer el nivel de exigencia que ha supuesto dicho estímulo para cada sujeto en cada momento. “Carácter de esfuerzo” González-Badillo (1995)
  • 25.
    RM en cadaserie mientras que el grupo NRF realizó s (es decir, la mitad de volumen). Después de las 8 entrenamiento, se observó que el grupo NRF mejoró que utilizar repeticiones al fallo (cuando no más), probablemente debido, entre otros factores, al m fatiga que produce en el organismo. Sin embargo A partir de la mitad de las repeticiones, la pérdida de velocidad es notable. Nótese que en la última repetición posible la velocidad es muy próxima a la asociada a la RM (ver Capítulo 2). Figura 5.2 Pérdida de velocidad dentro de una serie de sentadilla 0,400 0,525 0,650 0,775 0,900 1 2 3 4 5 6 7 8 9 10 11 12 13 14 15 16 17 18 19 20 21 22 23 24 25 26 Velocidadmediapropulsiva(m/s) Nº repetición
  • 26.
    Effects of velocityloss during resistance training on athletic performance, strength gains and muscle adaptations F. Pareja-Blanco1 , D. Rodrıguez-Rosell1 , L. Sanchez-Medina2 , J. Sanchis-Moysi3,4 , C. Dorado3,4 , R. Mora-Custodio1 , J. M. Ya~nez-Garcıa1 , D. Morales-Alamo3,4 , I. Perez-Suarez3,4 , J. A. L. Calbet3,4 , J. J. Gonzalez-Badillo1 1 Physical Performance & Sports Research Center, Pablo de Olavide University, Seville, Spain, 2 Studies, Research & Sports M edicine Center, Government of Navarre, Pamplona, Spain, 3 Department of Physical Education, Las Palmas de Gran Canaria University, Las Palmas de Gran Canaria, Spain, 4 Research Institute of Biomedical and Health Sciences ( IUIBS) , Las Palmas de Gran Canaria University, Las Palmas de Gran Canaria, Spain Corresponding author: Fernando Pareja-Blanco, Centro de Investigacion en Rendimiento Fısico y Deportivo, Universidad Pablo de Olavide, Ctra. de Utrera km 1, 41013 Seville, Spain. Tel.: + 34 653121522; Fax: + 34 954 348 659; E-mail: fparbla@gmail.com Accepted for publication 23 February 2016 We compared the effects of two resistance training (RT) programs only differing in the repetition velocity loss allowed in each set: 20% (VL20) vs 40% (VL40) on muscle structural and functional adaptations. Twenty-two young males were randomly assigned to a VL20 (n = 12) or VL40 (n = 10) group. Subjects followed an 8-week velocity-based RT program using the squat exercise while monitoring repetition velocity. Pre- and post-training assessments included: magnetic resonance imaging, vastus lateralis biopsies for muscle cross-sectional area (CSA) and fiber type analyses, one-repetition maximum strength and full load-velocity squat profile, countermovement jump (CMJ), and 20-m sprint running. VL20 resulted in similar squat strength gains than VL40 and greater improvements in CMJ (9.5% vs 3.5%, P < 0.05), despite VL20 performing 40% fewer repetitions. Although both groups increased mean fiber CSA and whole quadriceps muscle volume, VL40 training elicited a greater hypertrophy of vastus lateralis and intermedius than VL20. Training resulted in a reduction of myosin heavy chain IIX percentage in VL40, whereas it was preserved in VL20. In conclusion, the progressive accumulation of muscle fatigue as indicated by a more pronounced repetition velocity loss appears as an important variable in the configuration of the resistance exercise stimulus as it influences functional and structural neuromuscular adaptations. Objetivo: Comparamos los efectos de dos programas de entrenamiento de fuerza(RT) que sólo difieren en la pérdida de velocidad : 20% (VL20) vs. 40% (VL40) en las adaptacionesestructurales y funcionales del músculo. Métodos: Veintidós varones jóvenes fueron asignados aleatoriamente a un grupo VL20 (n = 12) o VL40 (n = 10). Los sujetos siguieron un programa de RT basado en velocidad de 8 semanas usando el ejercicio de sentadillas mientras se monitorizaba la velocidad de repetición. Las evaluaciones previas y posteriores a la capacitación incluyeron: resonancia magnética, biopsias del vasto lateral para análisis del tipo de fibra, análisis de tipo de fibra, fuerza máxima de una repetición y perfil de sentadillade carga máxima, salto de contramovimiento (CMJ) y Carrera de 20 metros en sprint. Resultados:VL20 tuvo similares ganancias de fuerza en squat que VL40 y mayores mejoras en CMJ (9.5% vs 3.5%, P <0.05), a pesar de VL20 realizando un 40% menos repeticiones. Aunque ambos grupos tuvieron un aumento de la sección trasversal y del volumen total del músculo cuádriceps, el entrenamiento con VL40 provocó una mayor hipertrofia de vasto lateral e interno que VL20.