Descargado 345 veces


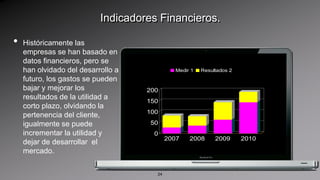


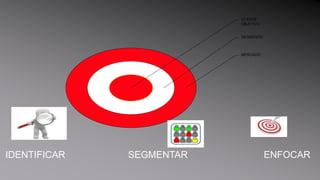
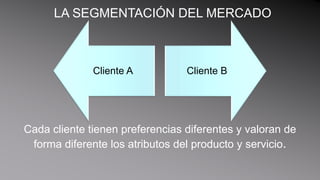

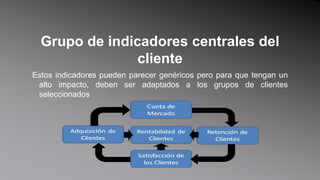
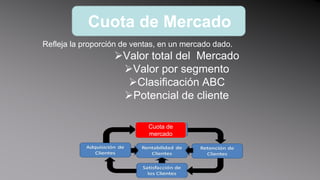


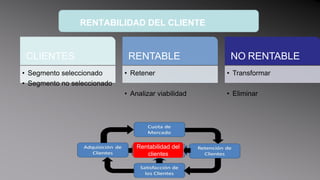
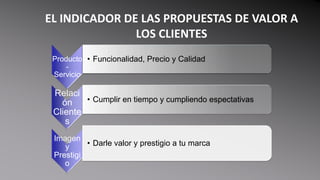


El documento explora el concepto del cuadro de mando integral (CMI) como herramienta de gestión en la era de la información, destacando su importancia en la alineación de objetivos estratégicos y la medición del rendimiento organizacional a través de indicadores financieros y no financieros. Se enfatiza la necesidad de innovar en la relación con los clientes, la segmentación del mercado y el desarrollo de habilidades en los empleados para el éxito empresarial. Además, se aborda cómo la era de la información requiere un cambio en los métodos de medición y gestión para asegurar la competitividad y el crecimiento a largo plazo.


![Balanced scorecard mct[1]](https://cdn.slidesharecdn.com/ss_thumbnails/balancedscorecardmct1-111014153857-phpapp02-thumbnail.jpg?width=640&height=640&fit=bounds)


